| Issue |
J. Eur. Opt. Society-Rapid Publ.
Volume 22, Number 1, 2026
|
|
|---|---|---|
| Article Number | 24 | |
| Number of page(s) | 15 | |
| DOI | https://doi.org/10.1051/jeos/2026012 | |
| Published online | 14 April 2026 | |
Research Article
Optimum asymmetric spatial and temporal distribution of femtosecond laser pulses in refractive surgery
SCHWIND eye-tech-solutions GmbH, Research and Development, Kleinostheim D-63801, Germany
* Corresponding author: This email address is being protected from spambots. You need JavaScript enabled to view it.
Received:
12
December
2025
Accepted:
8
February
2026
Abstract
Femtosecond laser-assisted refractive correction relies on temporally and spatially separated pulses that generate coalescent cavitation bubbles, forming a cleavage plane for tissue separation. Achieving optimal outcomes requires balancing laser-induced stress, mechanical dissection stress, and surface roughness. This work introduces a nonlinear absorption model and a theoretical framework to identify the optimum spatial and temporal distribution of single pulses. The analysis, based on inequalities involving scaling factors for spot size and track distance, defines a bounded solution space. Within this domain, the most favorable setting corresponds to minimum dose with maximum asymmetry, ensuring energy efficiency while enhancing surface smoothness, whereas the least advantageous of the optimum conditions occurs for higher dose and minimum asymmetry (compatible with optimum conditions), both enabling a theoretical bridge-free dissection. Bubble overlap emerges as a key determinant of cutting efficiency and smoothness, and an optimal window for overlap factors is delineated, minimizing treatment dose while preserving corneal quality through smoother stromal cuts.
Key words: Asymmetric spacing / Spatial and Temporal Pulse Distribution / Dose optimization / Surface smoothness / Femtosecond laser / Refractive Surgery
© The Author(s), published by EDP Sciences, 2026
 This is an Open Access article distributed under the terms of the Creative Commons Attribution License (https://creativecommons.org/licenses/by/4.0), which permits unrestricted use, distribution, and reproduction in any medium, provided the original work is properly cited.
1 Introduction
Refractive surgery has advanced with the introduction of ultrashort-pulse laser systems [1, 2]. Under high concentrated peak irradiances and shorter exposure times, in the picosecond and femtosecond (fs) range, one can not only break molecules as during photoablation, but even strip electrons from their atoms and accelerate them resulting in the generation of dense free electron plasma. If a critical value is exceeded, laser-induced optical breakdown (LIOB) occurs with a very fast increase of temperature and pressure, which leads to a rapid plasma expansion. This results in a shock wave propagating into the surrounding medium, causing the formation of a cavitation bubble, which may undergo a series of oscillations before ending in a small persistent gas bubble after some microseconds. Plasma-mediated ablation [3, 4] and photodisruption [5, 6] are the key laser–tissue interaction mechanisms underlying femtosecond laser-assisted techniques, enabling precise intrastromal dissection. In Photodisruption, microjoule-range pulses at high repetition rates and micrometer-scale spacing create cavitation bubbles that mechanically separate stromal lamellae, whereas in plasma-mediated ablation, lower pulse energies delivered at multi-MHz rates with strong pulse overlap result in tissue separation through cumulative free-electron-mediated effects without cavitation. The (asymptotic) size of the cavitation bubble leading to photodisruption grows with the cubic root of the applied (suprathreshold) pulse energy [7, 8]. Theoretical models and empirical data have substantiated the importance of identifying the fine differences between the two interaction mechanisms to explain the cavitation bubble dynamics and reliably estimating its size at any given single pulse energy [9].
Femtosecond lasers generate plasma and cavitation bubbles with substantially lower energy thresholds than longer-pulse systems due to nonlinear multiphoton absorption [10]. In corneal tissue, femtosecond optical breakdown typically occurs at pulse energies on the order of tens to hundreds of nanojoules, depending on numerical aperture, pulse duration, and tissue hydration, with reported breakdown thresholds in the range of approximately 25–200 nJ for commonly used clinical focusing conditions [10–12]. The resulting cavitation bubbles in intrastromal corneal surgery exhibit characteristic radii typically in the range of 0.7–3 μm, with upper clinical values approaching 4–5 μm at higher pulse energies [13–15]. Clinical systems generally avoid pulse energies that generate bubbles exceeding ~5 μm radius due to the increased risk of stromal disruption, endothelial stress, and irregular interface formation [16].
The affected diameter of a single spot is typically on the order of 1–10 μm, whereas the treatment zone diameter ranges from 6–9 mm, yielding a scale separation exceeding three orders of magnitude [15, 17]. Because of this extreme scale separation, the corneal surface may be regarded as locally planar both radially and azimuthally, independent of whether the global scan pattern is spiral, raster, or meander. Thus, the local geometry governing bubble overlap is effectively Cartesian.
Due to the scale separation, multiple laser pulses are sequentially delivered onto the cornea. Each laser pulse locally creates a small cavitation bubble separating the corneal tissue. The global process is an integral effect of the local process of each laser pulse. A larger bubble gives a faster treatment, but a lower resolution. On the other hand, a smaller bubble increases the resolution at the cost of increasing the treatment time due to an increased number of laser pulses invested in cutting the same area. Additionally, using laser pulses too close to the threshold of the material (for generating cavitation bubbles) would mean only imparting thermal effects instead of generating stable bubbles. All these factors make the energy selection a sensitive criterion.
The laser pulses in femtosecond laser-assisted refractive correction techniques are separated both spatially (spot and track separation conforming a pattern, Fig. 1) and temporally (pulse repetition rate and track frequency). The spatially and temporally scanned process eventually leads to a confluent (or coalescent) bubble (conforming a cleavage plane), enabling the separation of the tissue. The residual tissue bridges between cavitation cites have a significant clinical relevance. Histological and surgical experience suggests that residual tissue bridges remaining after femtosecond laser lamellar ablation are associated with increased interface roughness and less smooth cleavage surfaces; when the uncut gaps between cavitation sites approach a significant fraction of the cavitation bubble diameter, surface irregularities become more pronounced [18, 19]. While precise clinical thresholds are not universally defined, surgical practice suggests residual gaps larger than a few microns can influence interface smoothness and biomechanical stability postoperatively.
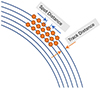 |
Fig. 1 Illustrative representation of the spatial distribution of cavitation bubbles determined by spot and track distances in femtosecond laser–assisted refractive correction. |
Individual pulses and cumulative effects may be governed by different underlying mechanisms. For instance, very different regimes have been observed for the interaction mechanisms of cavitation bubbles induced by spatially and temporally separated fs-laser pulses (at least for pulse energies well above the breakdown threshold) [20, 21]. Tinne et al. [8, 17] first investigated the interaction mechanisms of cavitation bubbles induced by two laser pulses that were both spatially and temporally separated. In a more recent study, Freidank et al. [15] presented high-speed videographic investigations performed at up to 50 million frames per second, of multiple pulse effects during intrastromal dissection in corneal tissue. They found that the bubble dynamics in corneal tissue are much more complex than in water. The laser-induced bubbles exist longer in tissue and are not spherical, instead multiple bubble lobes are formed along the elongated laser plasma within the cornea. These lobes expand preferentially along the corneal lamellae, which are approximately 2–3 μm thick, creating overlapping layers of bubbles aligned with the stromal architecture suggesting that spot spacing and pulse overlap, both in depth and across lamellae, play a critical role in determining whether the resulting cut is smooth or fragmented.
Several studies have investigated the impact of optimizing pulse energy, and temporal and spatial relationships between single pulses. Adapting the laser settings in femtosecond laser-assisted cataract surgery with increased vertical spacing (i.e., fewer pulses in the vertical direction) has shown to significantly reduce the number and size of “tags” (incomplete / misplaced cuts) at the capsule edge, thereby improving the cut quality [22]. Lombardo et al. [23] investigated the morphology of posterior stromal lenticules created with a femtosecond laser. Their results showed that lower pulse energy (0.50 μJ) produced much smoother posterior stromal lenticule surfaces, while roughness increased with increasing energy. Very fine spot spacing (2 μm) with low energy resulted in a surface comparable to mechanical microkeratome. In the study by Amann and Arba Mosquera [24], the authors conducted detailed simulations of femtosecond LIOB to assess how variations in spot spacing and track spacing influence corneal surface roughness. Their optimization framework consistently favored asymmetric spacing patterns, delivered at laser energies just above the LIOB threshold, to reduce surface irregularities.
In this regard and at least in the context of this work, we use the terminology symmetric vs. asymmetric spacings with respect to spot and track distances, as well as asymmetry ratio, according to previous publications [24]. Figure 2 provides a visual representation of symmetric and asymmetric pulse spacings, respectively. Symmetric spacings refer to conditions in which spot distance (Figs. 1 and 2) along the pathway (azimuthal in rotational scanning approaches and linear in meander scanning approaches) equals the track distance (Fig. 1 and 2) across the pathway (radial in rotational scanning approaches and line-wise in meander scanning approaches), which leads to an asymmetry ratio of 1. By exclusion, asymmetric spacings refer to conditions in which spot and track distances (Figs. 1 and 2) along and across the pathway, respectively, are different, this leads to an asymmetry ratio different from 1. Geometrically it would make no difference which one is higher (yet physically and spatiotemporally), so that we only explored asymmetry ratios >1 (also as per previous publications [24]), i.e., in which the spot distance (Figs. 1 and 2) along the pathway is clearly larger than the track distance (Figs. 1 and 2) across the pathway.
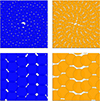 |
Fig. 2 Visual representation of symmetric pulse spacing (left) and asymmetric spacing (right) on an Archimedean spiral, shown at different zoom levels for the central region (top) and peripheral region (bottom). For symmetric spacing, the bubble boundary is shown as a black contour with blue fill; for asymmetric spacing, the bubble boundary is shown as a grey contour with orange fill. |
The understanding of the underlying mechanisms of distribution of laser pulses and their impact on outcomes may help optimize refractive laser systems. Symmetric spacing produces a regular, structured pattern in which the selected spot and track distances typically yield a low to moderate energy dose, resulting in a standard dissection. In contrast, asymmetric spacing arises from a stochastic pulse distribution that, when appropriately configured, can achieve a lower effective dose and influence the characteristics of tissue separation.
In previous works we presented analytical models to optimize the laser settings of ablation processes governed by linear [25] and non-linear (multi-photon) absorption [26]. The main purpose of this paper is to extend the non-linear absorption model and present a simple theoretical framework for identifying the optimum spatial and temporal distribution of single pulses for maximizing the cutting efficiency defined by the metrics: minimum amount of energy imparted to the tissue (i.e. minimum dose) and minimum corneal surface roughness.
Please note that this work does not aim to reduce cavitation energy to a level slightly above the threshold, as explored in previous studies [9, 26]. Instead, the objective is to provide a simplified theoretical framework for objectively determining:
-
the optimum total energy or dose appropriate for a given treatment or laser system, and
-
the optimum degree of asymmetry (spatial or temporal) corresponding to that total energy/dose for the same treatment or system.
The femtosecond laser cavitation bubble expansion and collapse remain highly confined compared to the overall treatment diameter, which can be several millimetres, which justifies the local geometric modelling assumptions employed in this work.
2 Material and methods
2.1 Calculation of the overall dose per treatment
The dose, or total fluence, in refractive laser surgery is defined as the average energy delivered per unit surface area of the treated corneal region. Because each laser pulse within a given cut is delivered with a constant energy level (though this may vary between cuts within a treatment), the dose effectively reflects the pulse density, that is, the number of pulses delivered per unit area.
The following equation applies to the calculation of the overall dose per treatment DT [26]: (1)
(1)
 (2)where ET is the total energy deposited during a treatment, Ep is the energy of a single pulse, AT is the area of the treatment and RT its radius. The number “n” represents the number of pulses assuming that all pulses carry the same energy, and pulses are approximately evenly distributed in the treatment area.
The total number of pulses delivered can be estimated geometrically. Assuming pulses are distributed in concentric circular paths (laps), the total number of laps and the average lap radius can be used to calculate the path length. This path length when divided by the spot distance gives the total number of pulses (for a single pass over the treatment area) as follows [26]: (3)where Spot Distances and Track Distance are distances between deposited neighboring spots along two essentially perpendicular axes (e.g., x and y, but also r and θ).
Therewith, the overall dose per treatment simplifies to: (4)
(4)
This expression shows that the Dose is independent of treatment area and is solely a function of pulse energy and spatial pulse density. The product of Spot Distance · Track Distance can be interpreted as the effective area assigned to each pulse, rather than the physical bubble size itself.
On the other hand, the lower limit (minimum) dose (DMin) per treatment for a bridge-free dissection can be equated as: (5)
(5)
This expression shows that the minimum dose is a function of pulse energy and bubble area, i.e., limited by the physical bubble size itself.
In this work, the terms “Bubble Area” and “Bubble Diameter” actually refer to the tissue disruption size (area or diameter) caused by a single bubble. It is not a time-dependent quantity since it refers to the effective size once the bubble completes the disruption work, thus it requires the bubble already collapsed in time after creating the disruption effect. Therefore, the Bubble Area refers to the planar projection of the cavitation bubble onto the cut surface, not the total bubble surface. In a 3D lattice, each Voronoi cell is formed by 4 or 6 neighboring spots, which occupy a very small spatial window relative to corneal curvature. Hence, the cornea is locally planar in 3D over each cell [24]. Therefore, local curvature effects are negligible at the scale of individual Voronoi cells, and global corneal curvature does not influence the local overlap statistics used in the model, justifying that scanning pattern geometry (spiral, raster, etc.) does not alter the local overlap physics, allowing the problem to be treated in a locally Cartesian framework.
2.2 Calculation of the overall dose per treatment as a function of scaling factors for Spot and Track Distance
Considering a scaling factor ‘F’ that is dimensionless and affects spacing relative to bubble size, one can calculate the Spot and track distance with respect to Bubble Diameter as follows: (6)
(6)
 (7)where F1 and F2 are scaling factors for Spot and Track Distance, respectively, and in general, values F1 or F2 > 1 represent effective spot or track overlap, and values F1 or F2 < 1 actually suggest disjoint spot or track cumulation. Therefore, if F1 and F2 are large, the Spot and Track Distances would be a small fraction of Bubble Diameter, resulting in more overlap, a higher number of pulses per area, and a higher dose, resulting potentially in a clean cut. Conversely, if F1 and F2 are small, the Spot and Track Distances may become large multiples of Bubble Diameter, resulting in less to no overlap, lower dose, but may pose a higher risk of incomplete cut.
Using equation (4), and applying equations (6) and (7), DT can be expressed as follows: (8)
(8)
2.3 Calculation of optimum window for Spot and Track Distance
The bubble overlap denoted by the scaling factors F1 and F2 plays a pivotal role in determining cutting smoothness and efficiency. We extend our previous works [24, 26] to define an optimum window for the overlap factors that minimizes overall dose per treatment and corneal surface roughness.
Numerical simulations and graphical visualizations of overlapping disk geometries presented in the Results were generated using Python (CPython implementation) in a Jupyter-based execution environment provided by OpenAI, employing standard scientific libraries including NumPy, SciPy, and Matplotlib.
3 Results
3.1 Minimum Overall Dose per treatment
Following equation (5), the Minimum Overall Dose per treatment (DMin) is related to energy of a single pulse (Ep), Area of a single cavitation bubble (Bubble Area) and Bubble Diameter as follows: (9)
(9)
 (10)
(10)
This is the Minimum Overall Dose per treatment (DMin) since using a lower number of pulses (i.e., smaller F1 · F2 product) (all leading to that bubble area) would always result in tissue bridges (since the Bubble Area · number of pulses would be smaller than the treatment area).
Comparing equations (10) and (8), the term for scaling factors for Spot and Track Distance for this Dose (DMin) should be as follows: (11)
(11)
3.2 Maximum required Overall Dose per treatment
As shown in our previous work [26], the spot and track distance for which adjacent bubbles would largely overlap in the two principal directions and just overlap in the two diagonal directions leaving no tissue bridges, can be calculated as follows: (12)
(12)
 (13)
(13)
From equation (8) combined with equations (12) and (13), the maximum required Dose (DMax) for this Spot and Track Distance is: (14)
(14)
Comparing equations (14) and (8), the term for scaling factors for Spot and Track Distance from this Dose (DMax) should be as follows: (15)
(15)
This is the Maximum required Overall Dose per treatment (DMax) since using a greater number of pulses (i.e., larger F1 · F2 product) (all leading to that Bubble Area) would result in tighter bubble overlap without reducing the amount of tissue bridges (since for F1 · F2 = 2, adjacent bubbles would largely overlap in the two principal directions and just overlap in the two diagonal directions leaving no tissue bridges).
Figure 3 visually illustrates the impact of the product of scaling factors F1 and F2.
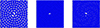 |
Fig. 3 Visual representation of symmetric pulse spacing (F1 = F2) on an Archimedean spiral, shown for different values of the product of scaling factors F1 and F2. Left: F1 · F2 = 1, adjacent bubbles do not overlap in the two principal directions and diagonal directions leaving tissue bridges. Middle: F1 · F2 = 2, adjacent bubbles largely overlap in the two principal directions and just overlap in the two diagonal directions leaving no tissue bridges. Right: F1 · F2 = 1.41, A good compromise that enables tissue bridge-free bubble overlap while minimizing the dose. |
A window for scaling factors can be estimated comparing the Minimum and Maximum Dose terms (Eqs. (11) and (15)): (16)
(16)
In the clinical context, the typical values of F1 and F2 are confined within upper and lower bounds. From both geometric necessity and clinical experience, meaningful contiguous cutting requires  , which corresponds to the minimum spacing for planar area coverage by circular projections. Practical clinical limits are typically
  which allows not very dense placement which can cause excessive mechanical disruption, although some commercial systems exceed this in specific protocols. In symmetric configurations, typical clinical values often fall in the range
  to
to  , corresponding to efficient overlap with limited energy redundancy [24]. Modern clinical systems increasingly employ F1 ≠ F2, for example, to optimize cut smoothness as simulations suggest that lower pulse energies (well above the LIOB threshold) combined with asymmetric spacings (spot-to-track distance ratio >> 1) may be effective to lower the roughness of laser cuts [24], such that the ratio of F2/F1 should be:
 (17)
(17)
 (18)
(18)
Representative numerical ranges are included in the examples below to make these quantities interpretable in practice.
3.3 Optimum window for Spot and Track Distance
From the two inequalities presented in equations (16) and (18), involving the scaling factors for Spot (F1) and Track Distance (F2), a bounded solution space can be defined (Table 1).
Corner solutions derived from the inequalities (Eqs. (16) and (18)). Each solution represents an extreme case of dose and asymmetry. The optimum lies at minimum dose with maximum asymmetry, whereas the combination of moderate dose and minimum asymmetry is the least advantageous of the optimum solutions.
The feasible region is delimited by the minimum and maximum values of the product F1 · F2 (dose) and the ratio F2/F1 (asymmetry). This rectangular domain naturally gives rise to four corner solutions, each representing an extreme combination of dose and asymmetry (Fig. 4). Among these, the most favorable setting is located at the corner of minimum dose and maximum asymmetry, which combines energy efficiency with smoother cuts. Conversely, the least desirable region corresponds to the corner of maximum dose and minimum asymmetry, which should be avoided. The optimal operating point therefore lies toward the lower-right corner of the solution space. The two intersecting lines highlight intermediate trade-offs: the vertical line represents moderate asymmetry across the full dose range, while the horizontal line represents moderate dose across the full asymmetry range. From this cross-section, a Proper Optimum was derived as the geometric mean of the vertical and horizontal solutions, lying near Solution 4. This calculated optimum (as indicated in Fig. 4) corresponds to an asymmetry of F2/F1 = 2.63 and a dose of F1 · F2 = 1.41.
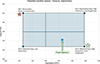 |
Fig. 4 Feasible solution space defined by inequalities (Eqs. (16) and (18)). The rectangle represents the bounded domain of dose (F1 · F2) and asymmetry (F2/F1). The four corner points correspond to extreme combinations. The most favorable setting is found at minimum dose and maximum asymmetry (Indicated with a Green star), while the least desirable of the optimum conditions is at maximum dose and minimum asymmetry (indicated with a Red star). The vertical and horizontal lines illustrate intermediate trade-offs across dose and asymmetry, from which a proper optimum is derived (blue marker), located near Solution 4. |
In addition to the four corner solutions derived from the inequalities (Eqs. (16) and (18)) representing the extreme case of dose and asymmetry, the case of F1 = 1 was also evaluated. The corresponding values of F1 and F2 for these combinations are summarized in Table 2, while the resulting ranges of F1 and F2 are provided in Table 3.
Calculated maximum and minimum ranges for F1 and F2.
Following the Photodisruption model [9], and using the different exemplary combinations of dose (F1 · F2) and Asymmetry (F2/F1), the Spot Distance, Track Distance, and corresponding dose for each combination are calculated for a particular LIOB threshold (Eth = 50 nJ) and Single Pulse Energy (Ep = 100 nJ), and presented in Table 4.
Spot Distance, Track Distance, and Dose calculated for different exemplary combinations of dose (F1 · F2) and asymmetry (F2/F1) for a particular LIOB Threshold Energy (50 nj) and Single pulse energy (Ep = 100 nJ).
Using LIOB Threshold energies loosely representing commercial systems currently used in ultrashort-pulse corneal tissue cutting, and the calculated optimum Single Pulse Energies compatible with previous works [9], for the different exemplary combinations of a proper optimum for dose (F1 · F2) and Asymmetry (F2/F1), the Spot Distance, Track Distance and corresponding Dose is presented in Table 5.
In Table 5, three different LIOB threshold energies (Eth = 35 nJ, 50 nJ, and 70 nJ) were analyzed, which loosely represent the range of commercial femtosecond laser systems currently applied for ultrashort-pulse corneal tissue cutting. For each threshold energy, three different single-pulse energies (Ep) were evaluated. The selection of Eth values follows the rationale established in our previous work [9].
The first Ep for each Eth was set at approximately 1.4 · Eth, corresponding to the minimum optimum predicted by the PlasmaCRT model (exp(1/3) · Eth). The second Ep was set at approximately 2 · Eth, representing the maximum optimum from the PlasmaCRT model (exp(2/3) · Eth), while also coinciding with the proper optimum predicted by the Photodisruption model. The third Ep was set at approximately 3 · Eth, nearly aligning with the maximum optima from both the Photodisruption and PlasmaSQRT models (exp(1) · Eth). This design also allows direct cross-comparison of specific Ep values across categories: for example, 70 nJ and 100 nJ were tested at both Eth = 35 nJ and Eth = 50 nJ, while 100 nJ and 145 nJ were tested at both Eth = 50 nJ and Eth = 70 nJ. In addition, Ep = 100 nJ was included in all three categories to explicitly demonstrate the effect of varying threshold energy on outcomes at a constant single-pulse energy.
4 Discussion
The bubble overlap plays a pivotal role in determining cutting smoothness and efficiency. There is no strict requirement for spot spacing to be smaller than the cavitation bubble diameter because effective tissue dissection in femtosecond laser procedures depends not solely on overlap along the scanning path (governed by spot spacing), but on the overall spatial and temporal interaction of cavitation bubbles, which is jointly determined by spot and track spacing. In this work, we defined universal ranges for F1 and F2 in relation to spot and track distances, where F represents the scaling factor relative to bubble size. As demonstrated in Tables 2–5, F1 (the scaling factor for spot distance) is consistently below unity under most conditions, indicating little to no overlap along the spot pathway. In contrast, F2 (the scaling factor for track distance) remains consistently greater than one, reflecting a stronger degree of overlap between adjacent tracks.
This strategy forms the basis of asymmetric spacing patterns (Spot Distance > Track Distance). Allowing larger spot spacing and even exceeding the bubble diameter can be beneficial when paired with reduced track spacing, as this compensates for the reduced overlap along the path by increasing overlap between adjacent scan lines. By minimizing consecutive spot overlap, these configurations reduce the chance of bubble interference caused by residual cavitation activity, particularly since the interpulse interval along a path is in the sub-microsecond range, which may be too short for cavitation bubbles to fully expand or dissipate. In contrast, inter-track intervals occur over milliseconds, allowing bubbles to reach full expansion before interacting with pulses from adjacent lines [9]. Therefore, avoiding spot overlaps along the scan pathway does not only act in the spatial but simultaneously in the temporal overlap domains.
This temporal separation enhances the predictability and control of tissue response as shown in the Figure 5. It is worth noting that Dose (F1 × F2) is the identical for both asymmetric spacing pattern (Figure 5B) and symmetric spacing pattern (Figure 5A), but asymmetry (F2/F1) and phase delay differs (1 vs. 2 × 30.5 and 0 vs. 0.5, respectively). Although the total delivered fluence (dose, energy) remains the same, yet as evident in the Figure 5, the triangular gaps in Figure 5B are smaller than the diamond gap in Figure 5A. This geometric difference has two important implications. First, the total uncovered area in Figure 5B (the sum of the two triangular gaps) is smaller than that of the diamond-shaped gap in Figure 5A, indicating improved coverage (higher fill fraction) for the same number of pulses. Second, the area of each gap in Figure 5B is substantially smaller, implying reduced tissue bridge dimensions. Spatially, this suggests improved coverage and potentially easier tissue separation in the asymmetric configuration for the same pulse and treatment cumulative energy. Temporally, the reduced consecutive spot interaction combined with longer inter-track delays promotes a more gentle and efficient laser–tissue interaction. Conversely, asymmetric settings with F2 > F1 (spot spacing larger than track spacing) and F1 < 1 (non-overlapping consecutive spots) allow both improved coverage, laser–tissue interaction efficiency, and easier tissue separation at the same pulse and treatment cumulative energy, as well as equivalent outcomes at reduced cumulative energy, with continuous trade-offs between these regimes.
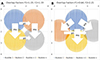 |
Fig. 5 The interpulse interval along a scan path lies in the sub-microsecond range, whereas inter-track intervals occur on the millisecond scale. A) Symmetric spacing increases the likelihood of bubble interference, as it does not exploit the spatial and temporal separation domains that limit pulse–bubble interactions. B) Asymmetric spacing minimizes consecutive spot overlap, reducing bubble interference from residual cavitation activity. The longer inter-track intervals allow cavitation bubbles to fully expand and dissipate before pulses from adjacent lines arrive. Here, individual cavitation events (bubbles 1, 2, 3, …, n) are illustrated using distinct colors to indicate their sequential generation. |
The residual gap in tissue cutting is characterized not by the nearest-neighbor spacing, but by the typical linear extent of the largest uncovered region within a unit cell. To characterize residual tissue gaps, one can introduce a characteristic void length ℓ defined as a linear measure proportional to the square root of the uncovered area fraction. Specifically, given by the expression ![Mathematical equation: $ \mathcal{l}=L\sqrt{[(\pi /4)(1-\mathrm{\Phi })]}$](/articles/jeos/full_html/2026/01/jeos20250097/jeos20250097-eq23.gif) , where Φ is the areal fill fraction, and L is the characteristic bubble projection diameter. This definition is calibrated such that square packing at kissing contact (Φ = π/4 ≈ 0.79) corresponds to ℓ/L ≈ 0.414, consistent with the diagonal extent of the central diamond-shaped void. Although ℓ does not represent the diameter of an equal-area circle, it provides a convenient and physically meaningful scaling for the linear size of residual gaps across different packing geometries. Values ℓ/L ≲ 0.3–0.5 correspond to fill fractions between approximately 75% and 90%, consistent with empirically observed conditions for effective tissue separation and the optimum window of the overlap fractions defined in this work.
, where Φ is the areal fill fraction, and L is the characteristic bubble projection diameter. This definition is calibrated such that square packing at kissing contact (Φ = π/4 ≈ 0.79) corresponds to ℓ/L ≈ 0.414, consistent with the diagonal extent of the central diamond-shaped void. Although ℓ does not represent the diameter of an equal-area circle, it provides a convenient and physically meaningful scaling for the linear size of residual gaps across different packing geometries. Values ℓ/L ≲ 0.3–0.5 correspond to fill fractions between approximately 75% and 90%, consistent with empirically observed conditions for effective tissue separation and the optimum window of the overlap fractions defined in this work.
It should be emphasized that overlap factors F1 and F2 can be regarded as universal (or generic) in a geometric and dimensional sense, not in the sense of being independent of biological or optical tissue properties. The parameters are dimensionless geometric overlap frequencies, defined as the ratio between the projected cavitation bubble diameter and the laser spot spacings along and across the scan pathway, respectively; equivalently, their reciprocals may be interpreted as normalized spacings. Owing to their dimensionless nature, these factors are applicable to any bubble size, independent of the absolute spatial scale of a given laser system, and allow direct comparison across different devices, pulse energies, and clinical platforms. While tissue biomechanics and optical properties influence the absolute bubble size, and thus the effective numerical values of F1 and F2, the underlying overlap physics is governed by these universal geometric ratios.
Regarding the effectiveness of asymmetric cutting and the optimized result, it would be ideal to design experiments to directly validate it, since experimental proof will always significantly increase the impact of the work. The novel task in this work is to help formally determine (from objective means) both dose and asymmetry (within optimum or at least adequate levels). The fact that all three aspects: (lower) pulse energy, (lower) dose, and (higher) asymmetry (positively) affect outcomes is evident and apparently universal, from previous literature.
Arba-Mosquera et al. [27] reported, aligned with other groups, that consistently in a large cohort consisting of three different countries, lowering the energy was one of the key factors to improve outcomes.
Arba-Mosquera et al. [26] mathematically modelled and demonstrated that too high energies are not consistent with minimum treatment fluence (due to the non-linear increase of bubble size with energy, i.e., above an energy range, an increase in pulse energy results in a fractional increase in bubble size, and under-proportional reduction in the required number of pulses; whereas below an energy range, a decrease in pulse energy results in a dramatic decrease in bubble size, with over-proportional increase in the required number of pulses). Further, this work interestingly opened the rigorous venue for asymmetric spacings. Using asymmetric settings, the optimum window shifts towards lower energies in a very relevant manner (without increasing the total treatment fluence). So that working with asymmetric spacings allows to effectively and safely work closer to the LIOB threshold.
Pradhan and Arba Mosquera [28] compared two ranges for pulse energies (~115 nJ vs. ~90 nJ, with symmetric and asymmetric settings, respectively) for similar treatment fluence (~750 mJ/cm2) and demonstrated that higher energies using symmetric settings provided not as good outcomes as lower pulse energies (enabled by the asymmetric spacings).
Theoretical models and experimental findings suggest that surface smoothness improves with well-managed bubble overlap, but this does not need to be necessarily achieved from redundant overlap along a single path. Instead, track overlap can be leveraged more efficiently, enabling a more balanced energy distribution. Amann and Arba Mosquera [24] explored the effects of pulse energy, spacings, and total delivered treatment energy independently using a computer modelling, reporting clear benefits in reducing pulse energy (for the same total treatment fluence); but also confirming that the asymmetric spacings were more beneficial in one than in the other direction (from a model perspective), in which consecutive pulses are placed further apart (even by distances beyond the bubble diameter, fully avoiding bubble overlap of consecutive pulses); with consecutive laps (or lines in a meander arrangement) placed tighter to maintain the total number of pulses and treatment fluence, as well as complete the overlap of the tracks for a successful separation. Further, this work allowed the inference of upper and lower levels for the required asymmetry.
We visually compare the asymmetric pattern (with spot distance < track distance) derived from the optimization approach used in this work, with a reverse asymmetric configuration in which the spot distance exceeds the track distance. Although both patterns can be designed to achieve the same nominal dose (F1 · F2 = 1.41), their behavior in the tissue may differ. The reverse asymmetry (F2/F1 = 0.58) appears to produce more persistent tissue bridges and less favorable stromal smoothness compared to asymmetric pattern with F2/F1 = 1.73 (Fig. 6). One possible explanation for this could be that increasing the spot distance reduces beneficial intra-path overlap while shifting most of the overlap to the inter-track domain, thereby altering the spatial–temporal balance of cavitation events. While reverse asymmetry might offer practical advantages, such as potentially increasing treatment speed, its influence on bubble dynamics and tissue separation may be less optimal than that of the asymmetric spacing prescribed in this work. These observations highlight that the manner in which asymmetry is achieved may be an important parameter for cutting efficiency and interface quality.
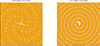 |
Fig. 6 Visual representation of asymmetric pulse spacing on an Archimedean spiral for a constant dose (F1 · F2 = 1.41) with two asymmetry configurations: F2/F1 = 1.73 (left) and F2/F1 = 0.58 (right). Here, the parameters “F1” and “F2” are scaling factors for spot and track distance respectively. The grey contour marks the cavitation bubble boundary, and the orange fill indicates the bubble interior. |
The theoretical findings are clinically supported in a large cohort analysis by Darzi et al. [29] who explored reasonable ranges of pulse energies and spacings (from 75 nJ to 130 nJ, with symmetric and asymmetric spacings in a wide range, and treatment fluences) confirming clear trends that lower pulse energies, asymmetric spacings, and lower treatment fluences provided better outcomes. Their results suggested that maintaining a consistent dose (~12 μm2 area assigned to a low energy pulse) achieved through asymmetric spacing such as 6.0 μm · 2.0 μm or 8.0 μm · 1.5 μm, is optimal for cutting efficiency and tissue smoothness. The requirement for overlap could be satisfied more effectively through optimized spatial and temporal distribution of pulses, rather than enforcing spot spacing to remain below bubble diameter. The integration of clinical data and predictive modeling supports the notion that decoupling spatial parameters, while controlling overall dose, enhances both tissue response and visual outcomes, providing strong empirical validation for the refined cavitation-based models proposed in earlier theoretical work [24, 26].
Sobutas and Arba Mosquera [30] explored the effects of pulse energy on the treatment depth using a computer modelling with clear benefits in reducing pulse energy (for the same total treatment fluence).
Verma and Arba Mosquera [9] introduced the plasma model and could mathematically demonstrate that for energies closer the threshold, the cavitation bubble remains constrained within the plasma volume; and only from a determined suprathreshold pulse energy are cavitation bubbles dominating the process.
Ryu et al. [31] compared using a different platform (two different models from Carl Zeiss Meditec, VisuMax 500 and VisuMax 800) the close-to-threshold plasma KLEx (85 nJ) and to a conventional low energy regime for the same platform (100 nJ). Both types of treatments were performed with the same treatment fluence (625 mJ/cm2). Authors reported both clinically and statistically significant differences between the two regimes. The study found that Plasma-KLEx with asymmetric spacings (Spot Distance > Track Distance), minimized microcavitation and created a lenticule with near-pure plasma, showing more favorable outcomes than Conventional-KLEx, yielding better early postoperative visual acuities and reduced induction of corneal HOAs. This study confirms the previous findings by Pradhan et. al. [28] using a different platform.
Park et al. [32] explored for a different platform the asymmetric spacings compared to a conventional symmetric spacings, both for a low energy regime (100 nJ) and same treatment fluence (625 mJ/cm2) and could confirm both clinically and statistically advantages for the asymmetric spacings, suggesting its universal validity.
The model presented in this work is based on several idealized assumptions, such as constant bubble size and homogeneous tissue, which inherently introduce certain limitations. Most of those limitations have been addressed in previous studies [9, 24, 26]. Notably, these works demonstrated that above the optima, the variability of the bubble effects is smaller than the energy fluctuations.
The product of the overlap factors (F1 · F2) determines the effective dose, with higher values corresponding to easier tissue dissection, whereas the ratio of the overlap factors (F2/F1) governs the degree of asymmetry, with larger ratios associated with reduced residual roughness. An additional constraint can be imposed such that F2/F1 ≥ F1 · F2, which implies F1 ≤ 1 and thereby prevents spot overlap along the scan pathway independent of dose considerations. Under this framework, achieving a higher dose at the same pulse energy corresponds to an increased product (F1 · F2), which is most effective when accompanied by greater asymmetry (see Table 4). This interplay is balanced by reducing track distances, enabling simultaneous control of dissection efficiency (dose) and surface smoothness (asymmetry). While Table 4 illustrates these relationships for a specific threshold and pulse energy, Table 5 extends the analysis across multiple threshold energies and corresponding single-pulse energies.
The equation (10) in our results represents the minimum dose one can apply while safely using laser energy with the highest efficiency, while equation (14) represents the maximum Dose for coalescence of cavitation bubbles leaving no tissue bridges. Any dose applied beyond these limits does not contribute to the physical process and is therefore redundant. The current development trend is toward lower threshold energies for cavitation bubble generation, with ~40 nJ as a representative value. Applying our method to this threshold energy allows identification of the proper optimum dose ranges. Considering minimum and maximum doses (F1 · F2 = 4/π and F1 · F2 = 2, respectively), and applying the Photodisruption model assuming the value of K (i.e., the coefficient of the irradiated tissue) equal to 1.42 [26], and a single pulse energy of 75 nJ (corresponding to the Proper Optimum of the Photodisruption model), yields an optimum dose range from 441 nJ to 695 nJ. Using proper optimum asymmetry (F2/F1 = 2.62), this leads to ideal spot and track spacings of 6.7 μm and 2.5 μm vs. 5.3 μm and 2.0 μm, for min and max doses, respectively. For the same Eth but for a single pulse energy Ep = 55 nJ (corresponding to the lowest Optimum of the Plasma CRT model), yields a higher optimum dose range from 570 nJ to 897 nJ. Using the same proper optimum asymmetry (F2/F1 = 2.62), this leads to slightly tighter spot and track spacings of 5.0 μm and 1.9 μm vs. 4.0 μm and 1.5 μm, for min and max doses, respectively.
The precise mechanism underlying the observed reduction in surface roughness with increasing F2/F1 ratio (asymmetry) remains unclear. Nevertheless, previous studies consistently support this relationship from a geometrical and clinical perspective.
An optimization problem as this one provides for a better treatment of the localized spacing of pulses in the used lattice pattern. The findings build upon the necessary spacing to ensure pulses effectively align to a hexagonal packed array (as determined for excimer lasers [33], and leading to the asymmetry range of 1.15–3.46 [24]). This gives the absolute minimum number of pulses to cover a specified area for near-constant overlap. We acknowledge that this may be difficult to do practically because of the laser properties: repetition rate most notably.
For a constant pulse energy, increasing the track distance reduces overlap between adjacent spot pathways, leaving residual ridge patterns. Conversely, larger spot distances produce a stepwise response, as the number of pulses contributing to a single corneal location decreases; while greater overlap lowers surface roughness, it simultaneously increases the local dose. This oscillatory behavior is analogous to Gauss’s circle problem in lattice geometry, as previously described for excimer ablations [33], where the number of overlapping pulses depends on the spacing of lattice nodes relative to the spot boundary. The underlying principle remains consistent across ablation modalities. The theoretical predictions discussed here align with observed clinical transitions in commercial femtosecond systems, where spot and track spacings are being decoupled to achieve superior ablation outcomes. Furthermore, the theoretical foundations are strongly supported by clinical evidence from recent studies [28], directly mirroring the model’s [24, 25] recommendation for maintaining a constant energy-per-area product.
Bohac et al. [34] analyzed longitudinal epithelial changes after the treatment of myopia with KLEx and the zonal change in epithelial thickness up to 12 months after SmartSight for myopic astigmatism with the SCHWIND ATOS femtosecond laser. They reported clinical outcomes in 80 eyes treated with Pulse energies ranging from 80 to 105 nJ, with a total energy dose between 440 and 583 mJ/cm2. Their outcomes led to the conclusion that changes in epithelial thickness after KLEx for moderate myopia with SmartSight were minimal, indicating a low level of epithelial hyperplasia without resembling a regression-inducing lentoid. Besides these results, Spot and track settings such as 5.9 · 2.9 μm, 6.0 · 2.1 μm, 6.0 · 4.4 μm, or 7.6 · 2.3 μm have been shown to deliver optimal stromal dissection with pulse energies as low as 75–80 nJ, corresponding to total fluences between 440 and 595 mJ/cm2. These parameters yielding low total doses without compromising tissue separation are not only clinically validated, but also associated with exceptional visual and anatomical outcomes in real-world settings [35, 36]. Furthermore, personal communication with experienced users of the SCHWIND ATOS system indicates that a single-pulse energy of 75 nJ combined with a spot-track setting of 7.0 · 2.6 μm performs well in practice, with no perception of clinically relevant tissue bridges during dissection. Assuming a threshold energy of Eth = 40 nJ and a resulting bubble diameter of 4.9 μm (using k = 1.5 from the Photodisruption model [9]), these settings correspond to F1 = 0.7, F2 = 1.9, F1·F2 = 1.32, and F2/F1 = 2.69. These values align closely with the proper optimum identified in the present analysis, suggesting consistency between the theoretical framework and practical observations.
The benefits of low energy, asymmetric geometry are underscored by long-term outcome data. In a four-year retrospective study evaluating over 4000 SmartSight procedures, excellent safety and efficacy profiles were demonstrated across a wide range of myopic and astigmatic corrections. Specifically, mean uncorrected distance visual acuity (UDVA) of 20/20 or better was achieved in 91.7% of eyes, with 99.7% achieving 20/40 or better. Furthermore, 96.2% of eyes were within ±0.50 D of the intended spherical equivalent refraction, and only 0.2% lost one or more lines of corrected distance visual acuity (CDVA), confirming both predictability and safety over time [37].
Additional insight into the effects of asymmetric spacing and low-energy parameters is provided in studies examining the physical quality of the lenticule interface. Using ex vivo and imaging analyses, researchers have shown that asymmetric, low-energy cuts produce smoother stromal surfaces and more regular lenticule geometry, compared to higher-energy or symmetric settings. Specifically, no visible tissue bridges or cavitation-related roughness were observed at the interface, and lenticule edge thickness remained well-defined and reproducible across varying cut depths and diameters [36]. These findings suggest that asymmetric pulse geometry allows efficient tissue separation without overexposure, supporting gentle and controlled dissection. This renders the question how can the “ease of dissection” be assessed as objectively and quantitatively as possible. Different previous works determined the “ease of dissection” as a subjective cardinal score [38]. We believe that one of the simplest objective, and quantitative metrics to determine “ease of dissection” may be the required dissection time over a series of treatments [39]. This is simple, objective, and quantitative; and allows to perform statistical comparisons for different approaches.
New scanning technologies for femtosecond laser ophthalmic surgery, such as multi-spot parallel scanning or strip scanning have been proposed [40]. The potential applicability of these findings to those the new scanning approaches can be discussed. If multi-spot parallel scanning or strip scanning set a fixed distance in one direction, then this work can provide the corridor of distances in the other direction, to balance dose and asymmetry in the best possible region. If multi-spot parallel scanning or strip scanning sets a distance range of selectable distances in one direction, then this work can provide the range of corridor of distances in the other direction, to balance dose and asymmetry in the best possible region. If multi-spot parallel scanning or strip scanning provides fully selectable distances in one direction, then this work can provide the full range of distances in the other direction, to balance dose and asymmetry in the best possible region. Based on these considerations, a practical framework compatible with emerging multi-spot or parallel scanning systems can be outlined. First, the optimum pulse energy should be identified, typically around 1.7 · Eth, from which the corresponding bubble size can be inferred. The optimum total dose (F2 · F2) may then be selected within identified optimum ranges of 1.3–1.6, and the asymmetry ratio (F2/F1) within identified optimum ranges of 2–3.5. Once these parameters are defined, the spot distance can remain fixed to avoid overlap along the pathway, while the dose can be modulated solely by adjusting the track distance. This approach allows energy and spot spacing to remain near their optimal values, while treatment efficiency and tissue separation quality are fine-tuned through a single parameter, track distance, constrained within well-defined limits.
All findings presented in this work are derived from geometric analyses, with no explicit treatment of the temporal domain. Nonetheless, the geometrical principles are consistent with and reinforced by temporal considerations, which we address here.
Bubble dynamics remain a source of uncertainty, as validated estimates of cavitation bubble collapse time in the living cornea are lacking. Reported values vary from ~8–10 μs for sub-μJ energies in water to ~1 ms for multi-μJ pulse energies in ex vivo corneas [17, 41]. Based on available data, we reasonably assume that bubble lifetime in the cornea is <1 ms, scales with bubble size (and thus pulse energy), and is shorter than in water due to the higher substrate fraction. For low pulse energies near threshold, bubbles typically undergo a single expansion–collapse cycle. With low energies (<100 nJ), lifetimes in the cornea are likely even shorter (<8 μs), reinforcing the benefits of temporal separation.
For a given dose, asymmetric pulse arrangements, where pulses are closely packed along the spot pathway but tracks are more widely separated (e.g., ELITA, Z8, Johnson & Johnson Surgical Vision, Inc) result in overlapping pulses separated by sub-microsecond intervals (MHz repetition rates), while overlaps between tracks occur over milliseconds. Under these conditions, consecutive pulses interact within the lifetime of cavitation bubbles, limiting their maximum expansion and creating mutual interference. In symmetric configurations (e.g., VisuMax, Carl Zeiss Meditec AG.), both spot and track distances are equal, so pulse-to-pulse overlap remains at the microsecond scale, and track overlaps are in the order of milliseconds, again preventing full bubble development. In contrast, in asymmetric settings (e.g., SCHWIND ATOS, SCHWIND eye-tech solutions GmbH.), where spot distance greatly exceeds track distance, create non-overlapping pulses (μs separation) but overlapping tracks at millisecond intervals. This allows cavitation bubbles to reach their maximum effect without interference from subsequent pulses. The difference across settings spans more than three orders of magnitude (>1000×) in overlap timing, which makes a critical distinction in tissue response.
Under optimal asymmetric spacing, overlaps occur on the millisecond scale, well beyond the bubble lifetime (<10 μs), which minimizes destructive pulse–bubble interactions. These considerations support the view that optimal surgical parameters represent a “sweet spot” balancing laser stress, mechanical stress, and surface smoothness. Our theoretical findings align with prior reports linking dissection quality, occurrence of OBLs, and visual recovery to laser settings [24, 36, 37]. Specifically, surface smoothness improves with lower pulse energy, tighter track distances, and increased asymmetry (especially above a 2:1 ratio). Laser stress decreases with reduced energy, larger spacing, and higher asymmetry by limiting bubble overlap. Mechanical stress, in turn, is minimized within the asymmetry range of ~1.15–3.46, where energy distribution balances cutting efficiency with tissue integrity.
There are other considerations which may benefit from the proposed strategy. For example, larger heating effects can cause a problem. For instance, separating the pulses with some form of a regionalized Sobol sampling can reduce cumulative heat load in one area, while still having asymmetry. At this regard, both using (close to) minimum dose as well as using asymmetric spacings with Spot Distance > Track Distance, both are independent simple measures to reduce heating. Actually, both together act synergistically by reducing the total energy deposition while non overlapping consecutive pulses; and still ensuring (facilitating) tissue bridge-free dissections.
Early visual recovery appears to depend more on minimizing laser and mechanical stress than on surface roughness alone. While smoother corneal interfaces predictably enhance vision, they also accelerate epithelial remodeling by providing a better baseline. Thus, reducing energy deposition and bubble interference may be more critical for POD1 outcomes than further minimizing residual roughness, though both factors contribute. In practice, low pulse energy with spot distances slightly larger than bubble size (avoiding spatial/temporal overlap along the pathway) and tight track distances creates the most favorable balance.
There are potential refinements to this work. On the one hand, we calculated the number of pulses based on the area of a flat disc. This may be refined to account for the true cutting surface resembling something between a spherical cap and a parabolic dish (enlarging the treatment area with respect to the disc). Further, one may account for the compression and deformation of the tissue under the contact element during the laser process [42]. But both these refinements do not change the presented findings, since the treatment area cancels out in the calculation of dose (Eqs. (1)–(3)).
We have used the photodisruption model in this work, and not the more recently introduced plasma model [9], which is less commonly applied so far. Earlier work based on this model proposes that the maximum surface smoothness is achieved at an infinite overlap (F = ∞, infinite dose = maximum smoothness), with F = 1.41 as the smallest factor permitting bridge-free dissection, and F = 1.19 as a reasonable compromise. In that work, we assumed symmetric conditions (F1 = F2). In asymmetric configurations, however, F1 and F2 can be selected independently, constrained by F1 · F2 ≈ 1.41 as a practical compromise between F1 · F2 = 2 for a bridge-free tissue dissection, and F1 · F2 = 1.27 (= 4/π) for the minimum dose. Furthermore, an asymmetry ratio F2/F1 > 2 is shown to effectively reduce roughness. This yields, for example, F1 ≈ 0.73 (Spot Distance ≈ 1.4 · Bubble Diameter) and F2 ≈ 1.92 (Track Distance ≈ 0.52 · Bubble Diameter), corresponding to the proper optimum solution determined in this study (dose (F1 · F2) of 1.41 and asymmetry ratio (F2/F1) of 2.62). More broadly, we propose a spot spacing range of 100–165% of bubble diameter, with track distances adjusted accordingly, as the geometric–temporal “sweet spot” for femtosecond laser refractive procedures. The presented findings may provide a foundation for future system designs to incorporate and expand upon these concepts.
5 Conclusion
The bubble overlap denoted by the scaling factors F1 and F2 plays a pivotal role in determining cutting smoothness and efficiency. Extending our previous works, an optimum window for the overlap factors has been defined, which optimizes overall dose per treatment and minimizes corneal surface roughness. Collectively, the clinical and biomechanical data confirm that spot spacings above 5 μm, when used in conjunction with lower pulse energies and asymmetric spacing, provide a robust foundation for safe, efficient, and high-quality corneal refractive surgery. A general consensus has emerged among femtosecond laser platform users that the “sweet-spot” energy density for currently available commercial systems lies in the range of 400–500 mJ/cm2. A proper optimum to achieve this energy density can vary slightly between clinical settings but increasingly shows a trend towards increased spot and track distance asymmetry, reduced pulse energy leading to a reduced dose, suggesting that the currently recognized “sweet-spot” energy density will further reduce as the technology evolves. The alignment of empirical results with theoretical models justifies the growing clinical trend toward dose-preserving, low-energy, asymmetric ablation paradigms in modern lenticule extraction.
Funding
This research did not receive any specific funding.
Conflicts of interest
The authors are employees of SCHWIND eye-tech solutions GmbH, Germany. The authors declare that there are no financial interests, commercial affiliations, or other potential conflicts of interest that could have influenced the objectivity of this research or the writing of this paper.
Data availability statement
This article has no associated data generated.
Author contribution statement
Conceptualization, SAM and SV; Methodology, SAM and SV; Software, N/A.; Validation, N/A; Formal Analysis, SAM and SV; Investigation, SAM and SV; Resources, N/A; Data Curation, N/A; Writing – Original Draft Preparation, SV; Writing – Review & Editing, SAM and SV; Visualization, SAM and SV; Supervision, SAM; Project Administration, SAM; Funding Acquisition, N/A.
References
- Saad A, et al., Refractive outcomes of small lenticule extraction (SMILE) Pro® with a 2 MHz femtosecond laser, Int. Ophthalmol. 44(1), 52 (2024). https://doi.org/10.1007/s10792-024-02915-2. [Google Scholar]
- Pradhan KR, Arba-Mosquera S. Smart, Sight correction of compound myopic astigmatism treatments with preoperative astigmatism >1.00 diopter using the SCHWIND ATOS: A retrospective case series, J. Refract. Surg. 40(5), e328–e335 (2024). https://doi.org/10.3928/1081597X-20240415-02. [Google Scholar]
- Teng P, et al., Acoustic studies of the role of immersion in plasma-mediated laser ablation, IEEE J. Quantum Electron. 23(10), 1845–1852 (1987). https://doi.org/10.1109/JQE.1987.1073233. [Google Scholar]
- Niemz MH, Klancnik EG, Bille JF. Plasma-mediated ablation of corneal tissue at 1053 nm using a Nd:YLF oscillator/regenerative amplifier laser, Lasers Surg. Med. 11(5), 426–431 (1991). https://doi.org/10.1002/lsm.1900110507. [Google Scholar]
- Aron-Rosa D, et al., Use of the neodymium-YAG laser to open the posterior capsule after lens implant surgery: A preliminary report, J. Am. Intraocul. Implant. Soc. 6(4), 352–354 (1980). https://doi.org/10.1016/s0146-2776(80)80036-x. [Google Scholar]
- Krasnov MM. Laseropuncture of anterior chamber angle in glaucoma, Am. J. Ophthalmol. 75(4), 674–678 (1973). https://doi.org/10.1016/0002-9394(73)90819-2. [Google Scholar]
- Reinstein DZ et al., Accuracy and reproducibility of artemis central flap thickness and visual outcomes of LASIK with the Carl Zeiss Meditec VisuMax femtosecond laser and MEL 80 excimer laser platforms, J. Refract. Surg. 26(2), 107–119 (2010). https://doi.org/10.3928/1081597X-20100121-06. [Google Scholar]
- Tinne N, et al., Effects of cavitation bubble interaction with temporally separated fs-laser pulses, J. Biomed. Opt. 19(4), 048001 (2014). https://doi.org/10.1117/1.JBO.19.4.048001. [Google Scholar]
- Verma S, Arba-Mosquera S, A refined model for ablation through cavitation bubbles with ultrashort pulse lasers, Photonics 11(11), 1047 (2024). https://doi.org/10.3390/photonics11111047. [Google Scholar]
- Vogel A, et al., Mechanisms of femtosecond laser nanosurgery of cells and tissues, Appl. Phys. B Lasers Opt. 81, 1015–1047 (2005). https://doi.org/10.1007/s00340-005-2036-6. [Google Scholar]
- Juhasz T, et al., Corneal refractive surgery with femtosecond lasers, IEEE J. Sel. Top. Quant. Electron. 5(4), 902–910 (1999). https://doi.org/10.1109/2944.796309. [Google Scholar]
- Dick HB, Elling M, Willert A. Femtosecond laser in ophthalmology – A short overview of current applications, Med. Laser Appl. 25(4), 258–261 (2010). https://doi.org/10.1016/j.mla.2010.07.005. [Google Scholar]
- Farjo AA, et al., Femtosecond lasers for LASIK flap creation: a report by the American Academy of Ophthalmology, Ophthalmology 120(3), e5–e20 (2013). https://doi.org/10.1016/j.ophtha.2012.08.013. [Google Scholar]
- Ratkay-Traub I, et al., Ultra-short pulse (femtosecond) laser surgery: initial use in LASIK flap creation, Ophthalmol Clin North Am. 14(2), 347–355, viii–ix (2001). [Google Scholar]
- Freidank S, Vogel A, Linz N Mechanisms of corneal intrastromal laser dissection for refractive surgery: ultra-high-speed photographic investigation at up to 50 million frames per second, Biomed. Opt. Express 13(5), 3056–3079 (2022). https://doi.org/10.1364/BOE.455926. [Google Scholar]
- Stonecipher KG, et al., Laser in situ keratomileusis flap complications and complication rates using mechanical microkeratomes versus femtosecond laser: retrospective review, Med. Res. Arch. 2(3) (2015). [Google Scholar]
- Tinne N, et al., Interaction mechanisms of cavitation bubbles induced by spatially and temporally separated fs-laser pulses, PLoS One 9(12), e114437 (2014). https://doi.org/10.1371/journal.pone.0114437. [Google Scholar]
- Minoguchi H, Teus M, Fu H. Atomic force microscopy and scanning electron microscopy for characterization of interface surface roughness after ELITA femtosecond laser treatments, Transl. Vis. Sci. Technol. 14(10), 30 (2024). https://doi.org/10.21203/rs.3.rs-4934376/v1. [Google Scholar]
- Mian S, Abbasi O, Juhasz T. Femtosecond laser-assisted posterior lamellar keratoplasty: Initial studies of surgical technique in eye bank eyes, Ophthalmology 112, 44–49 (2005). https://doi.org/10.1016/j.ophtha.2004.06.037. [Google Scholar]
- Tinne N, et al., Interaction dynamics of spatially separated cavitation bubbles in water, J. Biomed. Opt. 15(6), 068003 (2010). https://doi.org/10.1117/1.3526366. [Google Scholar]
- Tinne N, Lübking E, Lubatschowski H, Krüger A, Ripken T. The influence of a spatial and temporal pulse-overlap on the laser-tissue-interaction of modern ophthalmic laser systems, Biomed. Eng. 57, 302–305. https://doi.org/10.1515/bmt-2012-4115. [Google Scholar]
- Schultz T et al., Greater vertical spot spacing to improve femtosecond laser capsulotomy quality, J. Cataract Refract. Surg. 43(3), 353–357 (2017). https://doi.org/10.1016/j.jcrs.2016.12.028. [Google Scholar]
- Lombardo M, et al., Surface quality of femtosecond dissected posterior human corneal stroma investigated with atomic force microscopy, Cornea 31(12), 1369–1375 (2012). https://doi.org/10.1097/ICO.0b013e31823f774c. [Google Scholar]
- Amann H, Arba-Mosquera S. Optimization of the spot spacings for reducing roughness in laser-induced optical breakdown processes for corneal laser vision correction, Photonics 11(2), 114, (2024). https://doi.org/10.3390/photonics11020114. [Google Scholar]
- Arba-Mosquera S, Verma S. Analytical optimization of the ablation efficiency at normal and non-normal incidence for generic super Gaussian beam profiles, Biomed. Opt. Express 4(8), 1422–1433 (2013). https://doi.org/10.1364/BOE.4.001422. [Google Scholar]
- Arba-Mosquera S, et al., Analytical optimization of the cutting efficiency for generic cavitation bubbles, Biomed. Opt. Express 12(7), 3819–3835 (2021). https://doi.org/10.1364/BOE.425895. [Google Scholar]
- Arba-Mosquera S, et al., Influence of extrinsic and intrinsic parameters on myopic correction in small incision lenticule extraction, J. Refract. Surg. 35(11), 712–720 (2019). https://doi.org/10.3928/1081597X-20191003-01. [Google Scholar]
- Pradhan KR, Arba-Mosquera S. Comparing high and low energy outcomes on day one for SmartSight myopic-astigmatism treatments with the SCHWIND ATOS: a retrospective case series, BMC Ophthalmol. 23, 328 (2023). https://doi.org/10.1186/s12886-023-03076-z. [Google Scholar]
- Darzi S, Pradhan KR, Arba-Mosquera S. Enhancing predicted visual acuity after smartsight lenticule extraction: identifying key factors with machine learning, J. Refract. Surg. 40(12), e974–e984 (2024). https://doi.org/10.3928/1081597X-20241030-01. [Google Scholar]
- Sobutas S, Arba-Mosquera S. Model of the effects of femtosecond laser pulse energy on the effective z-position of the resulting cut after laser-induced optical breakdown, Photonics 11(8), 685, (2024). https://doi.org/10.3390/photonics11080685. [Google Scholar]
- Ryu S, et al., Optimizing plasma formation and minimizing microcavitation to enhance clinical outcomes in keratorefractive lenticule extraction, J. Refract. Surg. 41(7), e635–e644 (2025). https://doi.org/10.3928/1081597X-20250509-05. [Google Scholar]
- Park ES et al., Reducing higher-order aberrations after keratorefractive lenticule extraction using asymmetric spacing spot/track distances with low-energy levels, J. Cataract Refract. Surg. 51(10), 895–902 (2025). https://doi.org/10.1097/j.jcrs.0000000000001713. [Google Scholar]
- Verma S, Hesser J, Arba-Mosquera S. Optimum laser beam characteristics for achieving smoother ablations in laser vision correction. Invest. Ophthalmol. Vis. Sci. 58(4), 2021–2037 (2017). https://doi.org/10.1167/iovs.16-21025. [Google Scholar]
- Bohač M, et al., Epithelial remodelling in myopia after keratorefractive lenticule extraction, Ophthalmol. Ther. 14(6), 1237–1247 (2025). https://doi.org/10.1007/s40123-025-01138-7. [Google Scholar]
- Gabric I, Pradhan KR, Arba-Mosquera S. Unique features of the ATOS laser for lenticule extraction: programming, intraoperative software use, and dissection techniques, in Femtosecond Laser Assisted Lenticule Extraction: Principles, Techniques, Complication Management, and Future Concepts in KLEx, edited by W. Sekundo, F. M. Wagner (Springer Nature Switzerland, Cham, 2024), pp. 339–347. https://doi.org/10.1007/978-3-031-60424-9_24. [Google Scholar]
- Pradhan K, Arba-Mosquera S, Lenticule and interface properties and geometries in SmartSight®, in Femtosecond Laser Assisted Lenticule Extraction: Principles, Techniques, Complication Management, and Future Concepts in KLEx, edited by W. Sekundo, F. M. Wagner (Springer Nature Switzerland, Cham, 2024), pp. 329–338 (2024). https://doi.org/10.1007/978-3-031-60424-9_23 [Google Scholar]
- Pradhan KR et al., Clinical results of SmartSight in four years experience, in Femtosecond Laser Assisted Lenticule Extraction: Principles, Techniques, Complication Management, and Future Concepts in KLEx, edited by W. Sekundo, F. M. Wagner (Springer Nature Switzerland, Cham, 2024), pp. 349–369. https://doi.org/10.1007/978-3-031-60424-9_25. [Google Scholar]
- Taneri S, et al., Results of thin-cap small-incision lenticule extraction, J. Cataract Refract. Surg. 47(4), 439–444 (2021). https://doi.org/10.1097/j.jcrs.0000000000000470. [Google Scholar]
- Brar S, Ganesh S, Bhargav S. Comparison of intraoperative time taken for docking, lenticule dissection, and overall workflow for SMILE performed with the VisuMax 800 versus the VisuMax 500 femtosecond laser, J. Refract. Surg. 39(9), 648 (2023). https://doi.org/10.3928/1081597X-20230726-03. [Google Scholar]
- Li H, et al., Multi-focus non-periodic scanning method for femtosecond lasers based on DMD and galvanometer scanners [Invited], Chin. Opt. Lett. 22(5), 051701 (2024). https://doi.org/10.1364/COL.22.051701. [Google Scholar]
- Juhasz T, et al., Time-resolved observations of shock waves and cavitation bubbles generated by femtosecond laser pulses in corneal tissue and water, Lasers Surg. Med. 19(1), 23–31 (1996). https://doi.org/10.1002/(SICI)1096-9101(1996)19:1%3C23::AID-LSM4%3E3.0.CO;2-S. [Google Scholar]
- Kehrer T, Arba-Mosquera S, A simple cornea deformation model, Adv. Opt. Technol. 10(6), 433–450 (2021). https://doi.org/10.1515/aot-2021-0039. [NASA ADS] [CrossRef] [Google Scholar]
All Tables
Corner solutions derived from the inequalities (Eqs. (16) and (18)). Each solution represents an extreme case of dose and asymmetry. The optimum lies at minimum dose with maximum asymmetry, whereas the combination of moderate dose and minimum asymmetry is the least advantageous of the optimum solutions.
Spot Distance, Track Distance, and Dose calculated for different exemplary combinations of dose (F1 · F2) and asymmetry (F2/F1) for a particular LIOB Threshold Energy (50 nj) and Single pulse energy (Ep = 100 nJ).
All Figures
|
Fig. 1 Illustrative representation of the spatial distribution of cavitation bubbles determined by spot and track distances in femtosecond laser–assisted refractive correction. |
| In the text | |
|
Fig. 2 Visual representation of symmetric pulse spacing (left) and asymmetric spacing (right) on an Archimedean spiral, shown at different zoom levels for the central region (top) and peripheral region (bottom). For symmetric spacing, the bubble boundary is shown as a black contour with blue fill; for asymmetric spacing, the bubble boundary is shown as a grey contour with orange fill. |
| In the text | |
|
Fig. 3 Visual representation of symmetric pulse spacing (F1 = F2) on an Archimedean spiral, shown for different values of the product of scaling factors F1 and F2. Left: F1 · F2 = 1, adjacent bubbles do not overlap in the two principal directions and diagonal directions leaving tissue bridges. Middle: F1 · F2 = 2, adjacent bubbles largely overlap in the two principal directions and just overlap in the two diagonal directions leaving no tissue bridges. Right: F1 · F2 = 1.41, A good compromise that enables tissue bridge-free bubble overlap while minimizing the dose. |
| In the text | |
|
Fig. 4 Feasible solution space defined by inequalities (Eqs. (16) and (18)). The rectangle represents the bounded domain of dose (F1 · F2) and asymmetry (F2/F1). The four corner points correspond to extreme combinations. The most favorable setting is found at minimum dose and maximum asymmetry (Indicated with a Green star), while the least desirable of the optimum conditions is at maximum dose and minimum asymmetry (indicated with a Red star). The vertical and horizontal lines illustrate intermediate trade-offs across dose and asymmetry, from which a proper optimum is derived (blue marker), located near Solution 4. |
| In the text | |
|
Fig. 5 The interpulse interval along a scan path lies in the sub-microsecond range, whereas inter-track intervals occur on the millisecond scale. A) Symmetric spacing increases the likelihood of bubble interference, as it does not exploit the spatial and temporal separation domains that limit pulse–bubble interactions. B) Asymmetric spacing minimizes consecutive spot overlap, reducing bubble interference from residual cavitation activity. The longer inter-track intervals allow cavitation bubbles to fully expand and dissipate before pulses from adjacent lines arrive. Here, individual cavitation events (bubbles 1, 2, 3, …, n) are illustrated using distinct colors to indicate their sequential generation. |
| In the text | |
|
Fig. 6 Visual representation of asymmetric pulse spacing on an Archimedean spiral for a constant dose (F1 · F2 = 1.41) with two asymmetry configurations: F2/F1 = 1.73 (left) and F2/F1 = 0.58 (right). Here, the parameters “F1” and “F2” are scaling factors for spot and track distance respectively. The grey contour marks the cavitation bubble boundary, and the orange fill indicates the bubble interior. |
| In the text | |
Current usage metrics show cumulative count of Article Views (full-text article views including HTML views, PDF and ePub downloads, according to the available data) and Abstracts Views on Vision4Press platform.
Data correspond to usage on the plateform after 2015. The current usage metrics is available 48-96 hours after online publication and is updated daily on week days.
Initial download of the metrics may take a while.