Fig. 4
Download original image
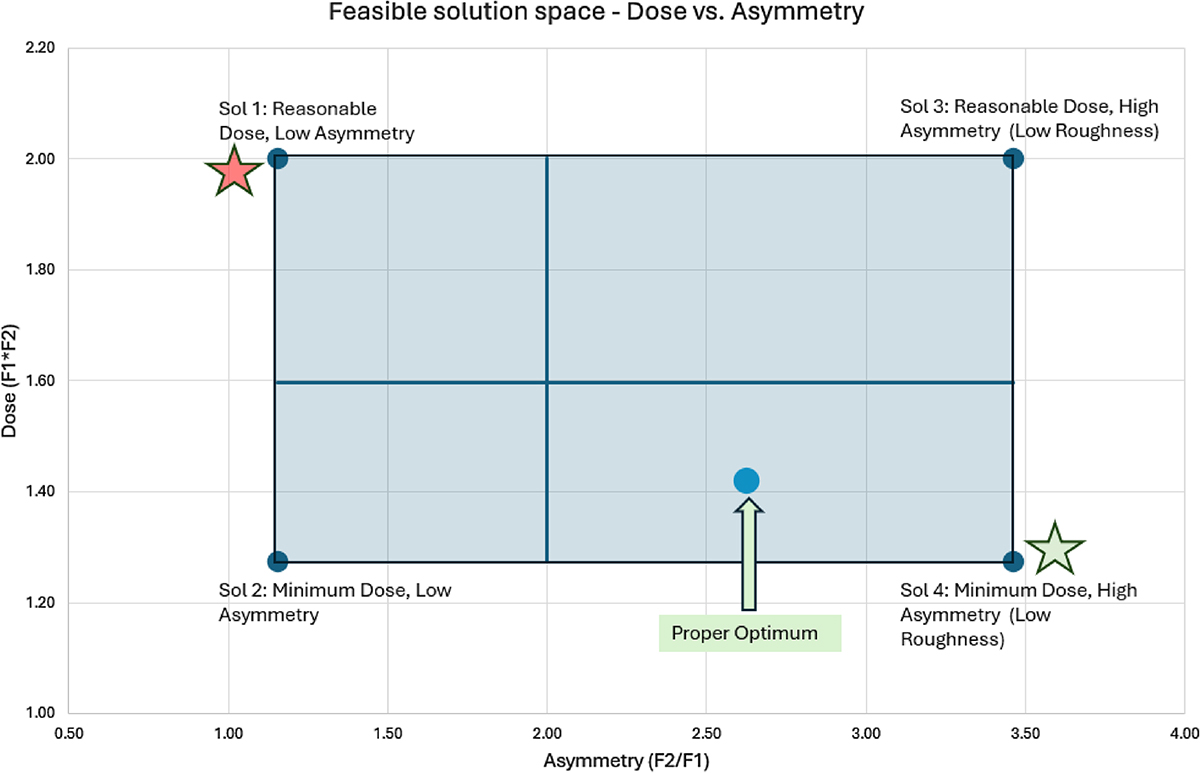
Feasible solution space defined by inequalities (Eqs. (16) and (18)). The rectangle represents the bounded domain of dose (F1 · F2) and asymmetry (F2/F1). The four corner points correspond to extreme combinations. The most favorable setting is found at minimum dose and maximum asymmetry (Indicated with a Green star), while the least desirable of the optimum conditions is at maximum dose and minimum asymmetry (indicated with a Red star). The vertical and horizontal lines illustrate intermediate trade-offs across dose and asymmetry, from which a proper optimum is derived (blue marker), located near Solution 4.
Current usage metrics show cumulative count of Article Views (full-text article views including HTML views, PDF and ePub downloads, according to the available data) and Abstracts Views on Vision4Press platform.
Data correspond to usage on the plateform after 2015. The current usage metrics is available 48-96 hours after online publication and is updated daily on week days.
Initial download of the metrics may take a while.