| Issue |
J. Eur. Opt. Society-Rapid Publ.
Volume 21, Number 1, 2025
|
|
|---|---|---|
| Article Number | 26 | |
| Number of page(s) | 28 | |
| DOI | https://doi.org/10.1051/jeos/2025014 | |
| Published online | 11 June 2025 | |
Review Article
Light and sound interplay in whispering gallery mode resonators
CNR-IFAC, Institute of Applied Physics “N. Carrara”, Via Madonna del Piano 10, 50019 Sesto Fiorentino, Italy
* Corresponding author: This email address is being protected from spambots. You need JavaScript enabled to view it.
Received:
25
November
2024
Accepted:
25
March
2025
Abstract
Whispering Gallery Mode Resonators (WGMRs) are robust and compact structures that confine resonant photons and phonons for extended time. This extraordinary confinement greatly enhances light and sound interactions and allows a plethora of fundamental phenomena to happen, ranging from nonlinear optics with continuous wave lasers to exceptional point going through mode shifting, splitting and broadening. These WGMR are highly versatile since their design can be tailored to the application by modifying either their size or the material used for their fabrication. We will focus on three dimensional WGMR, we will describe the physical working principles, their fabrication and their applications as sensors.
Key words: Whispering gallery mode / Resonators / Optomechanics / Sensors
© The Author(s), published by EDP Sciences, 2025
 This is an Open Access article distributed under the terms of the Creative Commons Attribution License (https://creativecommons.org/licenses/by/4.0), which permits unrestricted use, distribution, and reproduction in any medium, provided the original work is properly cited.
1 Introduction
The first studies on the generation of sound waves through the light-matter interaction are dated back to the 1870–1880 decade, and are especially associated with the activity of Alexander Graham Bell on telecommunications. Bell designed an ingenious device called the phonophone, using the photoconductivity properties of selenium foils discovered by Willoughby Smith in 1873. The phonophone allowed to translate speech into light modulation and then light modulation again into speech, achieving the first wireless phone call in history [1]. Obviously, this result sparked the interest of the scientific community but quantitative studies were limited by the technology available at the time (mostly due to the lack of sensitive microphones and bright light sources). Such technological barrier was overcome in the 20th century, with the advent of capacitive microphones and of laser sources, which brought new life to the subject and allowed the implementation of the photoacoustic (PA) effect in several fields [1]. The PA effect is the emission of an acoustic shockwave from an optical absorber after its excitation with a short laser pulse. The shockwave is the final step of a complex chain of thermo-elastic processes involving the absorber and the host material surrounding it. Thus, the PA effect is an effective tool for the investigation of the absorption spectrum of the absorber, its elastic properties and its non-radiative de-excitation, since it combines high optical selectivity and mechanical relaxation.
Recently, PA has been implemented with success in the biomedical field for its optical specificity towards natural (melanin, hemoglobin, lipids, collagen, etc.) or artificial (metal nanoparticle, dyes, quantum dots, etc.) optical absorbers and unhindered propagation of acoustic waves into biological tissues (skin, blood, etc.). Most PA detectors are piezoelectric ultrasound transducers and are available on the market in various designs, allowing to cover various possibilities in terms of detection (e.g. bandwidth, acceptance angle, sensitivity). However, they are difficult to miniaturize because this process leads to strong degradation in performances. Optical detection of the PA wave represents a solution to these problems, since it proved effective to combine miniaturisation with high-performances [2].
The PA effect excites the vibrational modes of particles regardless of their size. These natural vibrations were studied first by the Greek philosopher Pythagoras who noticed that string vibrations were greatly enhanced at given frequencies. Vibrational spectroscopy is a well-known non-destructive technique used for identifying the spectral fingerprints of several objects, such as stellar oscillations (millihertz range), electronics elements (kilohertz range) and large biomolecules (terahertz). However, the current optical and piezoelectric spectroscopy fails to detect faint vibrations of mesoscopic objects occuring in the megahertz-gigahertz frequency band [3].
The first studies combining photons and phonons (either optical or acoustic ones) can be traced back to Chandrasekhara Venkata Raman and Léon Brillouin. Both Stimulated Raman Scattering (SRS) and Stimulated Brillouin Scattering (SBS) are pure gain processes and, consequently, naturally phase-matched nonlinear phenomena. Both phenomena are widely used for vibrational spectroscopy, but they cannot resolve vibrations of mesoscopic objects, mostly because of the Rayleigh wing scattering [4]. A way to overcome all these challenges is to exploit optomechanical cavities having both optical and mechanical high quality factors. Whispering Gallery Mode Resonators (WGMR) are great candidates since they highly confine both light and sound. In essence, WGMR are high-finesse dual photonic-phononic cavities (also known as phoxonic cavities) and have shown to be an excellent enhancement platform to study light-matter interactions, such as stimulated nonlinear optical processes and frequency generation [5–7]. On a more general note, the applications of WGMR are vast and deep, including microlasers [8], sensors [9, 10], parity-time systems [11], nonlinear frequency generation [12] and quantum optics [13]. Compared to traditional MEMS (MicroElectroMechanical Systems), the WGMR readout can reach quantum limited levels of detection or shot noise [14]. WGMR offer several advantages, such as scalability, stability, chemical robustness, real time detection. They can also be doped and/or coated with functional materials such as graphene [15]. In WGMR systems not only the coupled light will applies a force in terms of radiation pressure and excites optomechanical oscillations (OMO) [16–18], but also traditional acoustic fields will induce mechanical oscillations [19]. Indeed, optomechanical based sensors differ from traditional optical sensors [20] in their interaction method. Traditionally, optical sensing is based on evanescent detection or evanescent fluorescent excitation, whereas optomechanical and PA sensing relies on OMO.
Finally, in general terms, WGMR can be split into two families depending on their geometry. Resonators with an almost planar geometry (like, e.g. embedded integrated microrings) are typically referred to as 2D resonator, whereas resonators with a significant extention in all directions are referred to as 3D resonators. In this review, we will focus on 3D WGMR.
2 Whispering gallery mode resonators
According to the Oxford dictionary, a Whispering Gallery is a gallery or dome with acoustic properties such that a faint sound may be heard round its entire circumference. Lord Rayleigh studied and identified the Whispering Gallery modes (WGMs) in Saint Paul’s cathedral in London [21] for the first time. In particular, this curved-guiding effect forced the acoustic wave to run along the gallery walls, producing a sticking effect to the wall, and was also energy efficient, allowing the wave to travel for the entire walkway length.
With the advent of laser technology and the possibility of refining extremely pure glasses, it was possible to translate this phenomenon into optics: using curved surfaces, an optical wave can be totally internally reflected while traveling around a circular medium. The fabrication materials for optical WGMR are mostly semiconductors, since the advanced fabrication techniques allow to produce with precision sub-micrometric structures, or glasses, since they minimize absorption losses, resulting in the best optical performances. All WGMR show cylindrical symmetry around one axis, have curved surfaces and high refractive index contrast with the surrounding medium. While running circular paths around the symmetry axis, light is subject to total internal reflections and the resulting guiding effect leads to the formation of the optical WGMs in close proximity to the interfaces (“wall sticking”). In this regard, WGMs can be easily and effectively visualised as rings of light localised at the boundaries. The physical process leading to the WGMs formation is the interference of the guided wave with itself on the these closed paths [22–25]. This formation is analogous to the one happening in interferometers (e.g. Gires-Tournis, bowtie), where the guiding is instead provided by a set of mirrors. Consequently, WGMs form a set of discrete confined electromagnetic modes and the systems sustaining them are called Whispering Galley Mode Resonators (WGMR). Since the wave must run several round trips without significant attenuation for the interference process to happen, WGMR must be fabricated with low-loss materials and must have a little footprint. There is a wide variety of 3D structures that can support optical WGMs (see Fig. 1), such as microspheres, microdisks or microtoroids, and even hollow structures such as microbubbles and microbottles are possible.
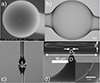 |
Figure 1 Series of panels showing examples of WGM resonators. Moving from left to right one has (a) a microsphere, (b) a microbubble, (c) a microbottle [26], (d) a microtoroid (adapted with permission from [27] © Optical Society of America). |
More formally, the WGMs are solutions of the vectorial Helmholtz equations after taking into account the appropriate boundary conditions on both the electric and the magnetic fields. In particular, this mathematical solution defines both the resonance wavelengths of the WGMs and their spatial distribution: they are mostly localized within the surfaces (physical boundary), but the field extends in a very small fraction in the surrounding environment as an evanescent tail. In practical terms, the evanescent tails plays an important role since it allows to couple the WGMs to an external waveguide injecting and/or extracting light from the WGMR. The WGMR-waveguide coupling systems can be different, as discussed in Section 2.1, but for being effective the waveguide mode and the WGM need to overlap spatially and be phase-matched. Figure 2 shows the WGM as a ring of light in a microsphere made of Erbium doped glass and a microbubble filled with a fluorescent dye.
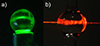 |
Figure 2 Whispering gallery modes in (a) a microsphere made of Erbium doped glass and (b) a microbubble filled with a fluorescent dye. |
2.1 Coupling systems
The waveguides used to launch laser light into a WGMR are either tapered optical fibers, integrated waveguides, or prisms (and prism-like structures).
Adiabatic tapered optical fibers (also called tapers) are the most used couplers since they are easy to align and can be mode-tuned by controlling their thickness. Fiber tapers are fabricated using a heating-pulling technique to form a narrow waist [28]. To perform this task, advanced fiber splicing equipment or specific cylindrical microfurnaces are needed. The appropriate taper waist can be as small as 1 μm in diameter, with the fundamental mode extending significantly into the free space surrounding the taper. Fiber tapers are mostly used with silica WGMR, such as microspheres, integrated microtoroids, microbottles and microbubbles. The main drawback of tapers is the fragility of the tapered region and its tendency to deteriorate over time [29]. Farnesi et al. proposed a new method based on long period gratings (LPG) for improved robustness of fiber coupling to silica WGMR [30, 31]. After the LPG, the fiber was adiabatically tapered to reduce the size of the excited cladding mode and increase its evanescent tail without radiating. These tapers are up to one order of magnitude thicker than the “standard” fiber tapers used for coupling light to WGM resonators, and therefore they are much more robust for practical applications. Figure 3 shows a microsphere and a microbubble coupled with an LPG and a regular taper. The difference in thickness of both systems can be clearly appreciated. The main drawback of this approach, despite its robustness, is its overall longitudinal size (i.e. few hundreds of millimeters), which leads to a poor integration level.
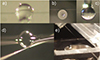 |
Figure 3 Series of panels showing examples of WGMR coupling systems. Moving from left to right one has: (a) a microsphere and an LPG taper, (b)–(c) a microsphere and a standard taper (b: top view, c: front view), (d) a microbubble with an LPG taper and (e) a microbubble with a standard taper. |
The most robust and compact system is the traditional planar waveguide, which however requires a careful alignment [32]. In 2016, Soltani et al. [33] reported on the coupling of crystalline microdisks to an integrated silicon waveguide on a silicon on insulator (SOI) platform. Silicon waveguides have a large refractive index compared to Lithium Niobate (LN) or lithium tantalate, the material of the crystalline microdisks. For achieving coupling, the waveguide had to be designed in order to provide optical modes with effective refractive indexes close to the WGMR and a geometry that ensured mode overlap and the right interaction length. Zhuang et al. [34] proposed a Silicon photonic crystal waveguide as a coupler for silica toroids. In this particular case, the large group index of the photonic crystal waveguide and the small difference between the refractive indexes of the coupler and WGMR allowed critical coupling with a high efficiency. Very recently, Farnesi et al. [35] proposed Si waveguides based on subwavelength metamaterial engineering as couplers. The authors demonstrated up to 99% coupling efficiency for microspheres and microdisks made of silica, LN, and calcium fluoride, with diameters from 300 μm to almost 4 mm.
The prism is also a very robust coupler, but achieving optimal alignment is quite challenging and proper mode beam shaping may be needed for improved efficiency. Prism coupling is typically used to efficiently couple light in and out of large WGMRs such as crystalline disks. Figure 4 shows a microcrystalline disk of several millimeters in diameter, a microdisk-waveguide system made in LN and the same disk when using a prism for light coupling.
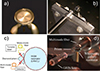 |
Figure 4 (a) Optical picture of a crystalline microdisk, (b) a microcrystalline disk coupled with a lithium niobate waveguide [32], (c) sketch of the prism-microdisk coupling system, (d) picture of the prism-microdisk coupling system implemented in our labs. |
The angle-polished fiber coupler is very similar to a prism and it consists of a fiber whose end facet has been polished to a specific angle to allow phase matching [36]. The fiber couples light into the WGMR via total internal reflection at the angle-polished facet. The advantages of this system are the waveguide light insertion and the robustness of prism coupling, without the bulk of the prism itself (see Fig. 5). The main disadvantage of the prism and of the angle-polished strategies is their need of a second coupler to collect the transmitted light, since, after the interaction with the WGMR, it propagates in free space. Angle-polished fiber couplers are conveniently used in the add-drop configuration, in which a second coupler is used to extract the light from the resonator.
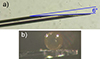 |
Figure 5 (a) Optical picture of an angle-polished fiber (polishing angle highlighted in blue), (b) picture of a microsphere coupled to an angle polished fiber. |
Once the coupling is achieved, laser light can be injected into the resonator to excite its WGM resonances. By scanning the laser wavelength of a tunable laser and recording the transmission with a detector, it is then possible to observe the lineshape of the WGM resonances and define a series of parameters to characterize the resonator (see Fig. 6). This list of figures-of-merit is inherited from interferometry and comprises, for example, the quality factor (Q-factor), the finesse, the contrast (or visibility), the full-width half-maximum (FWHM) and the free spectral range (FSR). Among these parameters, the quality factor, the finesse and the contrast are the most important in applications, since they quantify the sharpness of the WGM resonances, the average number of photon round-trips and the loaded energy in the WGM, respectively.
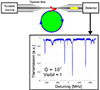 |
Figure 6 Sketch of a WGMR characterization setup showing a typical resonance with a Q-factor of about 107 and contrast (or visibility) close to 1. |
2.2 Fabrication techniques
We will discuss here the fabrication techniques of four different types of WGMR: microspheres, microbottles, microbubbles and microtoroids. The shapes and the material used for their fabrication are crucial for the applications. The optical characteristics of the chosen material will determine its optical properties and will enable the functionalization of the surface (see Sect. 5.1), which is the most important step for specific biochemical sensing aimed at accurately detecting the desired target.
2.2.1 Microspheres
Silica microspheres are usually fabricated by melting the end of a stripped standard telecommunication fiber. After melting, the tip solidifies through surface tension and a sphere with a radius of hundred of micrometers can be obtained. The melting can be achieved either with a hydrogen torch, a CO2 laser or a fiber splicer (see [24] and references therein). In all cases, the glass is heated and softened so that surface tension forms a spherical object with very low surface roughness at the end of the fiber stem. If one starts from a conventional telecom fiber, with clad diameter of 125 μm, spheres with diameter in the range of 125–350 μm can be easily produced. To obtain smaller spheres the fiber needs to be tapered first: in this case the taper is obtained by heating and stretching the fiber until it breaks. By melting the tip of the broken tapered fiber, spheres with diameter down to about 25 μm can be obtained [37]. A detailed protocol of fabrication using a fiber splicer can be found at JOVE [38]. Another class of (almost) spherical WGMRs is that of droplet resonators: after the seminal papers by Chang and Campillo [39, 40], these liquid resonators are again gaining attention [41, 42].
Figure 7 shows the fabrication set-up of microspheres using an oxygen-butane flame and a series of pictures of the microspheres obtained with this method. This particular set-up was built in our labs for the fabrication of active microspheres. We first prepared an active glass filament and then obtained microspheres with diameter in the range of 60–120 μm, depending of the initial diameter of the filament and the exposure time (below 2 s). Figures 7d and 7e show microspheres with their centers aligned with the supporting glass filament, while the panel e shows a microsphere that has been overexposed. In this case, the ratio between the microsphere diameter and the supporting stem diameter is too high and the stem is no longer able to support the weight of the microsphere. This, in turn, causes the bending of the stem, which assumes a “pipe” shape. Figure 7f, instead, shows a microsphere which has been underexposed.
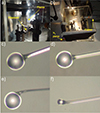 |
Figure 7 (a–b) Pictures of the fabrication setup implementing the flame fabrication technique (a: lateral view, b: top view), (c–d) microspheres with diameters of about 100 μm, (e) overexposed microsphere, (f) underexposed microsphere. |
2.2.2 Microbottles
Sumetsky et al. pioneered two very interesting and promising cavity geometries: the microbottle [43] and the microbubble [44]. The whispering-gallery bottle (WGB, as introduced by Sumetsky) is obtained by deforming a glass cylinder along its long axis, so to have the cylinder radius increasing smoothly up to a maximum and then decreasing again. WGBs combine standard WGMs with “bouncing ball” modes, localized near the stable closed rays that experience multiple reflection from the cavity wall. In their simplest form, WGBs, which routinely achieve Q-factors on the order of 107, can be created by heating an optical fiber (e.g. with a CO2 laser) to modify its radius and obtain the characteristic prolate shape of the microbottle. In practice, to produce a microbottle, two adjacent fiber stems are heated to their softening point and then pushed against each other to form the microbottle. By carefully tuning the push procedure and adding also a slight stretching, the geometric parameters of the microcavity can be tuned. This represents an advantage of WGB resonators with respect to the conventional fiber-based microspheres. Even more simply, polymeric microbottles can be fabricated by dispensing a polymer drop onto the surface of a glass optical fiber. In this case, a series of effects linked to the polymer surface energy and the surface tension between the polymer and the glass fiber lead to the formation of the microbottle (see Fig. 8). After this initial formation, the microbottle is then hardened by UV curing [45, 46]. A similar tecnique was used by Ward et al. [26] to fabricate active microbottles: an active glass rod was placed in contact with a silica capillary and then it was heated by a CO2 laser. Due to the different melting points of the materials, the rod glass melted and flowed on the outer surface of the silica capillary, forming a bottle shaped structure. Figure 9 shows the steps Ward et al. used for fabricating the active glass microbottle.
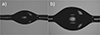 |
Figure 8 Optical pictures of the two polymeric microbottles with a diameter of about 240 μm (a) and 490 μm (b). Courtesy from CNR-IREA research group headed by Dr. Romeo Bernini. |
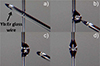 |
Figure 9 Fabrication steps to produce an active glass microbottle. Reproduced from [26] under Creative Commons License. |
2.2.3 Microbubbles
Microbubble resonators (MBRs) are hollow spherical WGMR fabricated by means of glass blowing techniques. Generally, a glass capillary is inflated by pressuring it with an inert gas (e.g. nitrogen) and then rapidly heating it (e.g. through a laser pulse [44] or an electric discharge [47]). This rapid heating produces a softening of the capillary walls, which expand to a spherical bulge due to the internal pressure: this shell, or bubble, is the resonator itself. The arc discharge technique for fabricating MBR was first described in [48]. Immediately after the authors modified the setup using four electrodes [47, 49]. Figures 10a and 10b show a sketch of the fabrication technique, whereas panel c shows a detail of the arc discharge unit and panel d shows one of the MBRs mounted on the discharge system after the inflation process. The MBRs were produced from fused silica capillaries and their typical radius fell in the 200–250 μm range.
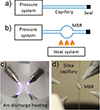 |
Figure 10 Sketch of MBR fabrication technique: (a) a capillary with a sealed end, (b) microbubble formation by heating, (c) picture of the arc discharge unit in our labs, (d) picture of an MBR after the arch discharge and inflation process. |
Finally, it is important to highlight that the MBRs optical features follow not only from the very low losses (both intrinsic and coupling ones), but also from their little difference (critical coupling condition). The intrinsic losses (η 2) are the ones connected with the quality of the fabrication process and take into account the material absorption, the scattering produced by the roughness of the MBR surface and the surface contamination by impurities such as dust. Coupling losses (κ 2), instead, quantify the energy exchange between the coupler and the resonator. These quantities can be retrieved by performing a fast wavelength scan of the WGM resonance and analysing the resulting cavity ring down (CRD) profile [50]. Figure 11 shows a CRD profile, whose analysis leads to η 2 = 2.8 · 10−5 and κ 2 = 6.4 · 10−6, proving the overall small values. In addition, the intrinsic losses η 2 can be used to compute an intrinsic quality factor Q0 = 3.3 · 108, proving the high quality of the the arc discharge fabrication process.
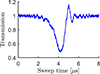 |
Figure 11 Cavity ring down profile of a MBR resonance. |
2.2.4 Microtoroids
Ultrahigh-Q toroidal microcavities were fabricated first by Kerry Vahala’s group [51]. The fabrication technique is based on several steps. First, the toroid is fabricated in an oxide-coated Si wafer using photolithography, then wet and dry etching, and finally laser reflowing. The laser reflowing is used to remove lithographic flaws and create a very smooth surface, and also to fabricate an optical isolated toroidal structure as the disk shrinks. Microtoroids are hybrid structures, in the sense that they can be fabricated in planar arrays, but the coupling system is still external which reduces the multiplexing capabilities.
3 Modeling of microbubble WGMR
For modeling the microbubble WGMs, we used a formal approach, using analytical expressions as much as possible and resorting to numerical methods only in a few instances. This makes the theory versatile and enables finalization that can be different from other models. This formal derivation follows the argument of Balac and Féron [52], where the WGMs of a microsphere are deduced, and constitutes an original contribution, since no similar dissertation about the MBR system was found in literature [53]. Guigot et al. [54] have published a numerical study of a microsphere with a cladding layer in order to classify the different family modes (core, cladding and composed modes) and their potential use in sensing. For more detailed numerical solutions such as global solution search procedures based on particle swarm optimization approach, we refer to the results published by [55, 56].
We will present here a summary of the different modeling published in literature as a help for better understanding the different sensing mechanisms. Teraoka et al. [57] published a first-order perturbation theory similar to the one widely used in quantum mechanics is developed for transverse-electric and transverse-magnetic photonic resonance modes in a dielectric microsphere. The same group published a general formula for the shifts in TE and TM polarization by adsorption of another dielectric medium, using a vector wave equation [58]. Yariv and Yeh [59] defined the common strategy to solve the different field components. In our modeling, the microbubble system can be divided into three dielectric sectors, each representing a different part of the microbubble and each having spherical symmetry. The first sector represents the material hosted inside the MBR and it is a core sphere of refractive index nc and radius Rc. The second sector represents the MBR walls and it is a spherical shell of refractive index nw with internal radius Rc and thickness W, or equivalently with external radius Re = Rc + W. Finally, the third sector represents the medium surrounding the MBR and it is a spherical shell of refractive index ne, internal radius Re and infinite thickness. The refractive indexes nc, nw, and nw are assumed to be uniform within each sector and therefore the index changes abruptly at the sectors boundaries.
Figures 12a and 12b show this modeling through a sagittal cut of the microbubble, using a 3D and 2D prospective, respectively. In these panels the dielectric sectors are depicted with different colors, the geometrical parameters are marked with arrows and the spherical coordinate system is shown. In addition, Figure 12c shows the orientation of the coordinate system with respect to a real microbubble, highlighting the correspondence of the z-axis with the capillary stem direction and of the xy-plane with the equatorial plane of the microbubble. The modeling here presented assumes uniform wall thickness along the meridians. When considering the wall tapering of the microbubble (cf. Fig. 12c), this may appear a strong approximation. However, since WGMs have a limited extension outside the equatorial plane, only the wall thickness at the equator is relevant for their properties and therefore this hypothesis does not limit the results of the model. As a consequence, only the wall thickness at the equator is relevant for the computation and it is used as the W value. A real approximation, instead, is made by neglecting the absorption of the various dielectric media, therefore assuming the refractive indexes to be real-valued parameters. This approximation produces real-valued characteristic equations and allows to implement basic numerical methods for their solution. Finally, focusing on the advantages of this modeling, we highlight its versatility in terms of refractive indexes and radii. In fact, since there are no constraints on these parameters, several experimental configurations can be simulated: both in terms of different materials by changing nc, nw, and ne, as well as in terms of different sizes by changing Rc and W (or equivalently Re).
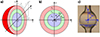 |
Figure 12 Panels (a) and (b) Two sketches of the microbubble modeling presented in Section 3. Different colors are used to mark the three dielectric sectors: blue for core, green for walls, red for external medium. Panel (c) shows the orientation of the spherical coordinate system used in this theory with respect to a real microbubble. |
By solving the scalar Helmholtz equation in spherical coordinates and then using the Hansen method to obtain the vectorial solution to the Helmholtz equation, it is possible to write the analytical expressions for both the electric field and the magnetic fields in each sector of the MBR. In particular, the scalar solution for the Helmholtz equation (an analogous of the time independent 1D Schrödinger equation) for a dielectric sector having index n (and therefore wavenumber k = k0 n = 2πn/λ0) is written as: (1)where the function F(kr) accounts for the radial dependence and the spherical harmonic Yℓ,m(θ, ϕ) accounts for the angular dependence. The function F(kr) is a key quantity for the computation of the modal volume, while Yℓ,m(θ, ϕ) fixes the WGM distribution along the meridian. With this factorisation, the field expression for the TE (transverse electric) modes becomes
 (2)
(2)
![Mathematical equation: $$ \mathcal{H}=\frac{\mathrm{i}}{\omega {\mu }_0}\left[\frac{\mathcal{l}(\mathcal{l}+1)}{r}\enspace F\left({kr}\right){\mathbf{Z}}_{\mathcal{l},m}+\frac{1}{r}\enspace \frac{\mathrm{d}}{\mathrm{d}r}\left({rF}\left({kr}\right)\right){\mathbf{Y}}_{\mathcal{l},m}\right] $$](/articles/jeos/full_html/2025/01/jeos20240078/jeos20240078-eq3.gif) (3)while the expression for TM (transverse magnetic) modes is
(3)while the expression for TM (transverse magnetic) modes is (4)
(4)
 (5)with the auxiliary vectors X
ℓ,m, Y
ℓ,m and Z
ℓ,m defining the spatial direction of the fields. These vectors are defined in equations (6)–(8) and form an orthogonal base, with Z
ℓ,m being parallel to
(5)with the auxiliary vectors X
ℓ,m, Y
ℓ,m and Z
ℓ,m defining the spatial direction of the fields. These vectors are defined in equations (6)–(8) and form an orthogonal base, with Z
ℓ,m being parallel to  and with X
ℓ,m and Y
ℓ,m being a combination of
and with X
ℓ,m and Y
ℓ,m being a combination of  and
and  . Indeed, this leads to the usual classification of TE and TM modes, where the electric field ℰ is totally tangential (i.e. orthogonal to the radial direction) for TE modes and the magnetic field ℋ is totally tangential for TM modes.
 (6)
(6)
 (7)
(7)
 (8)
(8)
The solutions of the scalar Helmholtz equation are the the Bessel functions and this allows to write ψ(r, θ, ϕ) as (9)with s = ℓ + 1/2. This form shows explicitly the r and the k dependence of the radial function and is useful when imposing the boundary conditions on electric and magnetic fields. It is in fact from these conditions that the characteristic equations for the TE modes and the TM modes arise, limiting the possible values for the wavelength λ and therefore defining the spectrum of the microbubble Whispering Gallery modes. For brevity, here we only discuss the procedure for TE modes: the procedure for the TM modes is identical and we just report the main result.
The first step of the procedure consists in reviewing the number of combination coefficients (i.e. the A1’s and the A2’s in Eq. (9)) that are necessary to define the function F(kr). In general, since the microbubble is made of three dielectric sectors, one has a piecewise definition of F(kr) where in each sector a couple (A1, A2) is used, leading to a total of 6 A’s coefficients. However, since the Bessel functions Yp(x) have a divergence in x = 0, they are not suitable for the core sector and therefore one must have  in that sector. At the same time, since the Bessel functions Jp(x) feature slowly decaying oscillations in the limit of high x, they are not suitable to describe the evanescent tail of a Whispering Gallery mode in the external sector and therefore one must have
  in that sector. In conclusion, only four coefficients are necessary to define F(kr), which can be written as
 (10)
(10)
In this equation, kc, kw, and ke are the wavenumbers in the different media ( ).
).
Combining equation (10) with equations (2)–(5) to impose the continuity of the ℰ and the ℋ tangential component at each dielectric interface produces a series of constraints on the A’s amplitudes. These constraints can be resumed using the matrix formalism and, for TE modes, one has (11)
(11)
 (12)with × representing the usual row-by-column product. For TM modes, instead, one has
 (13)
(13)
 (14)
(14)
In both cases, the auxiliary functions Ps(x) = xJs−1(x) − ℓJs(x) and Vs(x) = xYs−1(x) − ℓYs(x) are introduced for more compact expressions.
To have a solution with physical meaning, the amplitudes  have to be non-zero and this implies that ℳTE and ℳTM must have null determinant:
![Mathematical equation: $$ \begin{array}{cc}\mathrm{det}\left[{\mathcal{M}}_{\mathrm{TE}}\right]=0& \mathrm{for}\enspace \mathrm{TE}\enspace \mathrm{modes}\end{array} $$](/articles/jeos/full_html/2025/01/jeos20240078/jeos20240078-eq22.gif) (15)
(15)
![Mathematical equation: $$ \begin{array}{cc}\mathrm{det}\left[{\mathcal{M}}_{\mathrm{TM}}\right]=0& \mathrm{for}\enspace \mathrm{TM}\enspace \mathrm{modes}\end{array}. $$](/articles/jeos/full_html/2025/01/jeos20240078/jeos20240078-eq23.gif) (16)
(16)
In the end, equations (15) and (16) are the characteristic equations that define the WGM spectrum of the microbubble resonator. In fact, if the geometry and the indexes of the MBR are fixed, the remaining variables are the vacuum wavelength λ0 (which appears through the wavevectors kc, kw and ke) and the integer ℓ. In particular, by fixing the ℓ value (e.g. ℓ = ℓ1) and then scanning λ0, one finds a series of roots ( ,
,  ,
,  , …) which are the WGMs resonance wavelengths of that specific ℓ family. By repeating the root-finding procedure for different ℓ values (e.g. ℓ1, ℓ2, ℓ3, …), one can reconstruct the overall WGM spectrum.
Once the roots  are found, the amplitudes
  of each WGM can be found by inverting equations (11) and (13). We highlight that since λ0’s and ℓ’s values are now known, the matrices ℳTE and ℳTM are fully computable, without any unknown parameter. For brevity, we report the inversion procedure only for the TE modes: the procedure for the TM modes is analogous. Since ℳTE has null determinant from the characteristic equation (15), the vector
  in equation (11) can be inverted up to a free component (i.e. three A’s can be written as a function of the fourth). We choose A
c as the free amplitude and rearrange the system in equation (11) so that terms with A
c are on the right side. Rows two and three give
in equation (11) can be inverted up to a free component (i.e. three A’s can be written as a function of the fourth). We choose A
c as the free amplitude and rearrange the system in equation (11) so that terms with A
c are on the right side. Rows two and three give (17)which can be resolved using Cramer’s rule:
 (18)
(18)
 (19)
(19)
Then, using the fourth row from equation (11), one obtains A
e: (20)since
  and
and  are given by equations (18) and (19).
The procedure to deduce the A’s amplitudes for TM modes is the same and the final results are: (21)
(21)
 (22)
(22)
 (23)where q = nw/nc. Comparing the expressions for the TE and TM cases, one notices that the refractive index ratio q = nw/nc plays a more important role in the TM case, due to the q
2 factors in the numerators.
(23)where q = nw/nc. Comparing the expressions for the TE and TM cases, one notices that the refractive index ratio q = nw/nc plays a more important role in the TM case, due to the q
2 factors in the numerators.
Figure 13 shows a sketch of the MBR highlighting the three dielectric sectors and the trend of the radial function F(kr) for the fundamental WGM. In Figure 13, we assume a silica MBR (nw = 1.45) filled with water (nc = 1.33) in an air environment (ne = 1). Due to the higher index of the microbubble walls, the mode is confined in the walls sector and only evanescent tails are present in both the core and the external sectors. Even if these evanescent tails represent a tiny fraction of the field distribution, both have important roles for the microbubble applicability. The external tail, in fact, can couple the WGM to a waveguide mode, allowing light injection and extraction. The core tail, instead, allows to sense particles in proximity or in contact with the internal wall, enabling the implementation of the microbubble as an optical sensor.
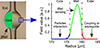 |
Figure 13 Sketch of the different dielectric zones of the MBR (left) and F(kr) function for the fundamental WGM (right). Colors are used to highlight the sector over which the function extends: blue for the core, green for the walls and red for the external medium. |
Sumetsky [43] reported on the first solution for the eigenfrequencies of MBRs using the Wentzel–Kramers–Brillouin (WKB) approximation. One year later, Rauschenbeutel et al. [60] published a full scale wave equation calculation using the adiabatic approximation for a solid microbottle. In that modelling, the resonator has a parabolic shape along the z-axis with a small variation of the resonator radius. This small variation allows to separate the radial and the axial coordinates, obtaining a solution that can be written as E(r, ρ, z) = Ψ(ρ, z)exp(imφ). The maximum angular momentum modes are located close to the surface and therefore, the radial component of the wave vector is negligible compared to the axial and azimuthal one. The total wave vector is: (24)where λ is the vacuum wavelength and n the refractive index. The symmetry of the system is cylindrical and there is no propagation at the caustics, thus the azimuthal and axial wave vectors can be written as:
 (25)
(25)
 (26)where Rc is the radius at the caustic, and Rc
k = m. The function Ψ(ρ, z) can be separated as the product of the two functions Φ(ρ, z) and Z(z) (Ψ(ρ, z) = Φ(ρ, z)Z(z)) with Φ(ρ, z) being the solution of the Bessel equation and Z(z) being a function which depends on the profile of the resonator. For a parabolic profile, Z(z)’s equation is very similar to the one of an harmonic oscillator:
(26)where Rc is the radius at the caustic, and Rc
k = m. The function Ψ(ρ, z) can be separated as the product of the two functions Φ(ρ, z) and Z(z) (Ψ(ρ, z) = Φ(ρ, z)Z(z)) with Φ(ρ, z) being the solution of the Bessel equation and Z(z) being a function which depends on the profile of the resonator. For a parabolic profile, Z(z)’s equation is very similar to the one of an harmonic oscillator: (27)where the term
  is equivalent to the total energy of the oscillator and the term
  is equivalent to the potential energy of the oscillator. The function Z is square integrable, and it gives a discrete set of energy levels and the following eigenvalues
 (28)
(28)
The corresponding solution of equation (27) is the Hermite polynomial of degree q: (29)with
![Mathematical equation: $$ {C}_{{mq}}=[\Delta {E}_m/(\pi ){2}^{(2q+1)}(q!{)}^2{]}^{1/4} $$](/articles/jeos/full_html/2025/01/jeos20240078/jeos20240078-eq47.gif) where Cmq is a normalization constant. From these equations, we can see that the profile of the resonator will directly influence the axial dependence of the electrical field and the spectral distribution of the axial modes [61]. The radial dependence is a combination of the Bessel functions and the solution can be written as equation (10).
where Cmq is a normalization constant. From these equations, we can see that the profile of the resonator will directly influence the axial dependence of the electrical field and the spectral distribution of the axial modes [61]. The radial dependence is a combination of the Bessel functions and the solution can be written as equation (10).
4 The sensing mechanism
4.1 Label free mechanisms: mode shift, broadening and splitting
Optical microcavities like WGMR show a high contrast (order of 0.95), a high quality factor (over 106) and a narrow FWHM (from MHz to GHz), making them promising for optical sensing. In particular, if a small perturbation has to be detected, the steep resonance fringe allows to read little shifts of the resonance position as significant changes in the system transmission (Fig. 14a, blue curve). Otherwise, if large perturbations have to be detected, the steepness allows to accurately define the position of the resonance on a larger detuning scale (see Fig.14a, black curve).
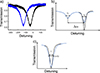 |
Figure 14 Sensing mechanism: (a) mode shifting, (b) mode splitting (Δω is the detuning between the symmetric and asymmetric mode, while γ is the mode linewidth), (c) mode broadening. |
The traditional label free sensing mechanisms are based on monitoring the resonance changes such as: mode shift (Fig. 14a), mode splitting (Fig. 14b) and mode broadening (Fig. 14c). Monitoring the mode shift is the most common sensing technique. When an analyte aggregates at the surface of the WGMR, it interacts with the evanescent part of the WGM field, inducing not only a shift in the wavelength, but also a change in the Q-factor. This change is due to the losses that the analyte aggregation introduces: consequently a broadening of the resonance is observed. Mode shift and mode broadening are usually complementary techniques, since the mode shift can be caused by an environmental change not related to the analyte.
Mode splitting is originates from the removal of the degeneracy of the clockwise and counterclockwise modes when a particle aggregates to the WGMR surface. This technique can only be used when the WGMR has ultrahigh Q factors. Mode splitting and mode broadening are self-referenced techniques which make the detection unaffected by environment. A detailed explanation of these techniques can be found in several review articles or books [9, 62].
4.2 Fluorescence based detection and spectroscopy
There has been some tentative of demonstrating that WGMR can be effective for fluorescence detection, or labeled approach. The intrinsically small Stokes shift of fluorescence dyes may produce excitation and scattered light interferences, especially when the excitation source is a tunable diode laser. The wide gain profile of the semiconductor easily masks the emitted fluorescence due to the overlap with the emission spectrum of the dye. Pastells et al. [63] demonstrated that the measured scattered signal is just the excitation laser scattered by the microsphere and convoluted by the filter, and not the linear fluorescence (see Fig. 15). Pastells et al. proposed for the first time the use of nonlinear optical techniques for sensing in WGMR.
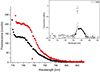 |
Figure 15 Scattered light measured with a hand-held spectrometer from a batch of microspheres with As204-Dylight800 1:2 ratio (As204-Dylight800 covalently bound to the surface microsphere of a diameter of about 140 μm) for two different pump powers: 148 mW (red squares) and 98 mW (black squares). Inset: Laser spectrum measured with an optical spectrum analyser. |
Fluorescence or Förster resonance energy transfer (FRET) is another technique that is widely used in sensing and/or imaging. In FRET there are two fluorophores, one acting as donor and the other one as acceptor. The donor and the acceptor have to be very close to each other (around 10 nm), they need to have a good overlap and they must be correctly oriented. FRET can occur at the interface of a WGMR under the condition of very short distance between donor and acceptor. The complexity of the FRET process makes it very sensitive to characteristic of the host environment (e.g. its pH or he concentration of ions, etc). Additionally, the absorption spectrum of the donor must not overlap with the absorption spectrum of the acceptor, otherwise the fluorescence of the acceptor could be directly excited from the pump laser. FRET combined with WGMR detection was first introduced by Wang et al. [64], who showed that the interaction between FRET and WGMs enhanced the sensing performance by four orders of magnitude.
Frequency comb (FC) generation or cascaded Raman lasing are by far more interesting for molecular fingerprinting than non coherent techniques. Frequency combs are a broadband and stable coherent source with equally separated lines that can be used to interrogate molecular fringerprints. FC and Raman lasing can be used in different spectroscopic configurations [65]. FC generation can be either solitonic or non-solitonic, with the first producing an ultra-broadband laser source. For a detailed description of the nonlinear phenomena occurring in microcavities, we refer to Chembo et al. [7]. Figure 16 shows the generation of cascaded Raman laser lines in a MBR, pumped at 779 nm in the near infrared band (NIR).
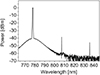 |
Figure 16 Cascaded Raman generated in a MBR pumped at 779 nm, showing the first and second order Raman laser lines. |
4.3 Optoplasmonics
Optoplasmonics can be described as the combination of optical microcavities with metallic nanoparticles (MNPs) that sustain localized surface plasmon resonances (LSPRs). A surface plasmon resonance occurs at the interface of a dielectric medium and a metal, and it originates from the coupling of the electronic charge density with an electromagnetic mode. The hybrid system highly benefits from the coupling of both resonances (i.e. the cavity resonance and the LSPR) since it increases the overall sensitivity. The MNPs can be either labels of the analytes or nanoantennae [66]. MNP act as plasmonic hotspots and, near resonance, they can increase the scattering and radiation losses and therefore change the cavity resonance. Coupling MNP to WGMR can reduce the resonance linewidth and improve sensitivity [67] and this approach can be implemented in surface enhanced Raman scattering (SERS) spectroscopic measurements. Plasmonic nanoparticles can be grown directly on the surface [68] or using a controlled deposition by means of carousel forces [69].
4.4 Optomechanical and photoacoustic detection
In the last decade optomechanical sensing has gained a well deserved recognition. Optomechanical sensing can be split into two categories, based on its working principle. It is passive, if the detection is based on radiation pressure; it is active, if the detection is based on SBS. Usually, radiation pressure involves mechanic vibrations in the megahertz range, whereas SBS or Brillouin lasers frequency vibrations are in the gigahertz range. In the case of radiation pressure, the coupled light induces a parametric instability [18, 70] and obviously requires the coexistence of high optical and mechanical Q-factors. A detailed theoretical description of the dynamical back-action was given by Kippenberg et al. [17]. Another interesting approach can be found in the paper by Li et al. [71]. In this paper, Li et al. describe the dynamical system as quantum Langevin equations, picturing the mechanical resonator and the cavity fields as quantized bosonic fields. Figure 17 shows an illustration of the self-induced radiation pressure oscillation. When the laser frequency is locked on the side of a resonance, a huge circulating power is confined into the WGMR and this induces a mechanical bending of the cavity due to radiation pressure. This bending translates into a periodical modification of the optical path, shifting the resonance and periodically modulating the transmission with a frequency Ωm.
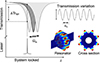 |
Figure 17 Sketch of the transmission signal associated with optomechanical vibrations in WGMRs. |
When a particle is adsorbed into the surface, the oscillation will change its frequency due to the mass change of the resonator, in analogy with traditional optical sensing. Sub-pg mass sensing was first demonstrated using a microtoroid WGMR [27]. Figure 18 shows a render of the working principle of a mass sensor based on a microspherical WGMR developed by Yu et al. in 2016 [72].
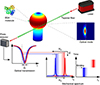 |
Figure 18 Sketch of a mass sensor based on a microspherical WGMR. When a bovine serum albumina (BSA) molecule binds to the surface of the microsphere, the optical mode shifts, as well as the mechanical frequency of the system. The acoustic mode involved in the detection is a radial breathing mode. From [72]. |
When the mechanical oscillations are due to SBS, the sensing is made by measuring the changes in the Brillouin structural mode. In 2009, Tomes and Carmon demonstrated that silica microspheres can generate both a Stokes photon and an acoustic phonon through an electrostrictive-induced SBS process in the backward direction [73], a decade later Yang et al. [74] demonstrated the possibility of exciting SBS in the forward direction. Liquid droplets can also amplify hypersonic waves and allow forward-scattering processes [75]. In this particular case, the generated surface-acoustic waves showed much lower frequencies than that of typical Brillouin phenomena [76].
Figure 19a shows a sketch of a microspherical Brillouin laser. The pump laser launched into the spherical WGMR is sufficient to excite forward SBS lasing, which propagates resonantly into the microsphere since it fulfills the mode matching condition. In this situation, the cavity is triply resonant: the pump and the Stokes photon together with the acoustic phonon (SBS) are resonant (see Fig. 19b). This triple resonant condition can be easily perturbed by the environmental conditions (temperature, mechanical vibrations, etc.), making the system an exceptional platform for sensing. All these properties (i.e. narrow linewidth and easy-to-measure MHz signals) combined with the characteristic molecular vibrations of the target are be very helpful for establishing a molecular bar-code. Even though the principle is quite simple, measuring the shifts can be quite challenging. For this reason, Li et al. have proposed a pump and probe optical system [77].
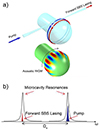 |
Figure 19 (a) Sketch of the forward SBS generation in a microsphere and the associated acoustic WGM (the acoustic mode is a wineglass mode), (b) optical spectrum of the triply resonant condition. Adapted from [74]. |
As discussed in Section 1, ultrasound or PA sensing based on all-optical detection is a great alternative to piezo-electric transducers. WGMR can optically detect acoustic waves through the photo-elastic and photo-thermal effects. The first demonstrations of PA detection were achieved with hybrid set-ups. The authors were resorting to piezo-electric transducers to excite the acoustic wave with the disadvantage of having the WGMR and the transducer immersed or partially immersed in water [78–80]. Figure 20a shows a picture of an initial setup used in our laboratories to verify the PA emission of gold nanorods (GNRs) hosted inside an MBR (the MBR position is highlighted by a green circle). In this initial setup, the PA response is detected with a piezo-electric transducer (visible on the left side), with the MBR was placed in the transducer acoustic focus. Figure 20b shows two PA signals measured with the advanced setup described in [19], where Frigenti et al. were the first one to demonstrate an all-optical generation and detection of an ultrasound signal. In this second setup, the all-optical status was achieved since the PA wave was triggered by a light pulse and the wave were detected by the shift induced into the MBR optical resonances. With respect to the initial setup and the hybrid configurations, the system is not submerged in water and therefore the taper is physically separated from the fluidics, which is confined within the MBR and its capillary stem.
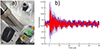 |
Figure 20 (a) Picture of an initial setup used to verify the PA generation from the the GNR inside the MBR, using a piezoelectric transducer for the detection, (b) Ultrasound signal detected through an all-optical reading of the PA wave, using an advanced all-optical setup [19]. |
Monifi et al. [78] reported a proof-of-concept by measuring a PA signal using an encapsulated microtoroidal WGMR and a taper using an UV-curable low index polymer, whereas Chistiakova et al. [79] used a microsphere: both groups immersed the resonators in water to match the acoustic signal impedance. In 2017, Kim et al. [80] used a microbottle to measure an external PA signal in air. In 2019, Frigenti et al. [19] used a MBR to sense the PA signal generated by a gold nanorod solution (GNR) inside the MBR, with the whole system placed in air.
5 Sensing applications
5.1 Chemical and biochemical sensing
The first straightforward sensing application of WGMR is a refractometer. The change on refractive index (RI) is usually the proof of concept when authors report on a new architecture. Microspheres were the first WGMR studied and proposed as RI sensors [81–83], followed by microtoroids [84], thin capillaries or liquid core optical resonators (LCOR) [85, 86], microbubbles [44, 48], and crystalline microtoroids [87].
To have a selective sensor, especially a biochemical sensor, the surface of the WGMR needs to be functionalized. The surface functionalization is a chemical modification of the transducer surface, usually through covalent reactions. There are several chemical procedures or protocols to minimize the unwanted non-specific effects and coat the surface with very thin (maximum thickness below the penetration depth of the evanescent field) and homogeneous layers to preserve the high quality of the transducer. The choice of the chemical protocol must be based on the specificity, the affinity and the stability of the bio-receptor. Silanization is the most common approach and it is based on covalent binding of the silane groups with the glass surface and enables a further functionalization with ligands or receptors. Another technique is the use of biotin and/or streptavidin layers to bind biotinylated molecules. Figure 21 shows a render of four different biosensing schemes that are based on the following biological recognition elements (BRE): antibodies, streptavidins, aptamers and enzymes. The BRE will bind to the corresponding analytes: antigen, biotin/biotinylated proteins, proteins, and amino acids. Immunosensors are antibody-based sensors, while aptasensors are aptamer-based sensors. Antibodies and aptamers show high affinity and specificity towards the analytes, due to their molecular complementarity. The beauty of aptamers relies on the possibility of being selected in vitro for any given target. Enzymes are specific for both the reaction they catalyze and the substrate they recognize, and are subject to regulation of their activity by other molecules, but their activity depends on physical and chemical environments. Detailed descriptions of the different chemical protocols can be found in other extensive reviews such as Foreman et al. [89] or Cai et al. [90].
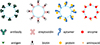 |
Figure 21 Top row: schematic representation of a WGM biosensor, resulting from the union of a WGM resonator and a sensing layer. Middle row: main ligands or receptors (antibodies, streptavidin, aptamers, enzymes). Bottom row: main analytes (antigens, biotin(ylated) proteins, aminoacids). Reproduced from [88]. |
Biochemical sensors are highly specific due to the molecular affinity we just mentioned, but the surface functionalization can degrade the quality factor of the resonators. Figure 22b shows the slight change in Q-factor and contrast of the resonance after silanization, while Figure 22c shows their drop by an order of magnitude once the antibody is covalently bound to the silane and the free binding sites blocked with a short peptide [63, 91].
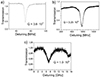 |
Figure 22 WGM resonance recorded at different steps of the functionalisation process: (a) before the process started, (b) after silanization and (c) after an antibody is covalently bound. |
Stephen Arnold’s group pioneered the sensing applications of WGMR. The group demonstrated the feasibility of detecting very large objects like bacteria [92] as well as very small ones like virus [93, 94]. In [93] the model system is a RNA virus known as MS2, which kills E. coli, but is harmless to humans, while the negative control is Phix174, another E. coli virus having different epitopes. Both viruses are icosahedral viruses like HIV. In the case of influenza A [94], the authors were able to detect single virions, even though this result was obtained for non-specific sensing. Arnold’s group also studied protein orientation by measuring the shift ratio between the fields polarized parallel and perpendicular to the surface [95]. Following this paper, Vollmer et al. studied conformational changes using bacteriorhodopsin as a model system [96], showing potentiality for studying protein misfolding diseases or anomalous aggregations like Creutzfeldt-Jakob’s disease.
Microspherical WGMR based sensors have been extensively used as biochemical sensors, Giannetti et al. [97] demonstrated the possibility of using polymeric layers as an alternative to silanes for IgG detection. Zhu et al. [98] demonstrated the possibility of using aptamers as BRE for thrombin detection. Following this pioneering work, Pasquardini et al. [91] used microspherical WGMR to detect two different thrombin aptamers and one vascular endothelial growth factor (VEGF) aptamer. Thrombin functions as a coagulation factor and it is involved in many pathological diseases, like atherosclerosis and thromboembolic diseases. Thrombin-15 (a 15-mer DNA-aptamer) binds to the fibrinogen exosite and Thrombin-29 (a 29-mer one) binds to the heparin exosite of thrombin protein. VEGF is an important regulator of angiogenesis and it promotes the migration and proliferation of endothelial cells and the formation of new blood vessels from preexisting capillaries. The detection of these blood proteins in clinical and laboratory measurements is time consuming and costly, mainly due to the lack of available antibodies. The authors tested the performance of the WGMR aptasensors in a microfluidic flow cell under laminar flow conditions in buffer solutions and in a real matrix, a 10% unfiltered human serum solution, and they also tested the reusability of the WGMR sensor. The sensor regeneration was done by 50 mM NaOH solution and the WGMR aptasensors were then used for another detection cycle [91]. Figure 23a shows a typical sensorgram of thrombin binding to a WGMR immobilized with TBA-15 in 1:10 unfiltered human serum, following a single addition of thrombin (red dots). Figure 23b, instead, shows the thrombin binding to a regenerated WGMR immobilized with TBA-15, following three additions of thrombin (5 μL of 0.3 mg/mL thrombin each).
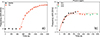 |
Figure 23 (a) Sensorgram of thrombin binding to a WGMR immobilized with TBA-15 in 1:10 unfiltered human serum (one thrombin addition). (b) Sensorgram of thrombin binding to a regenerated WGMR immobilized with TBA-15 (three additions, 5 μL of 0.3 mg/mL thrombin each). Adapted from [91]. |
MBR have also been proposed as biosensors and they are of particular interest since multiplexed sensing can be achieved. Berneschi et al. proposed a procedure for a spatially selective immobilization of antibodies, via photochemical activation, on the inner surface of the microbubbles [99, 100]. Figure 24 shows the multi-selective immobilization of two different IgG labeled with AlexaFluor647 (red) and AlexaFluor488 (green).
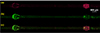 |
Figure 24 Fluorescence images of two MBRs fabricated on the same capillary. (a) Immobilization of goat anti-rabbit IgG labeled with AlexaFluor647 bound on the inner surface of the MBR on the right side. (b) Goat anti-rabbit IgG labeled with AlexaFluor488 bound on the inner surface of the MBR on the left side. (c) Merging of the previous images. Reproduced with permission from [99]. |
5.2 Optoplasmonic sensors
Arnold et al. also pioneered the use of hybrid WGMR to enhance the detection of single virions [101]; a RNA virus MS2 with a mass of 6 ag was detected using the metallic shelled WGMR. One year later, the same authors reported the detection of a single Thyroglobulin (Tg), a thyroid cancer marker, and of bovine serum albumin (BSA) proteins with masses of only 1 ag and 0.11 ag (66 kDa), respectively [102]. Figure 25 shows the sensorgram for Thyroglobulin detection, an optical picture of the resonator and the Q-factor of the hybrid WGMR.
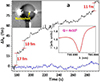 |
Figure 25 The resonance shift curve (black) shows pulses when single Tg proteins adsorb to the gold nanoshell coating the WGMR equator. Blue curve shows the background without the protein nor the gold nanoshell. Insets: optical image of the hybrid WGMR (top left) and resonance profile (bottom right). Adapted from [102]. |
Frank Vollmer group has been using the optoplasmonic enhancement to detect biochemical interactions such as conformational changes of DNA polymerase [103]. The authors studied how a change in enzyme polarisability or volume resulted in a change in WGM resonance frequency. The same group provided evidence for the macromolecular rate theory of enzyme catalysis by measuring negative heat capacity change via maltose-inducible α-glucosidase (MalL) temperature-dependent single-molecule kinetics [103]. The group has also published a study of the response of optoplasmonic WGMR based sensors upon the attachment of single protein [104] and novel single molecule dynamometer (force gauge) combining optical tweezer and a hybrid WGMR [105]. The authors used the thermo-optical effect initiated by single molecules binding to a plasmonic nanorod [104]. Instead of injecting WGMs with low power, the authors opted to inject high power into the WGMs, generating thermo-optoplasmonic (TOP) effects. With their optoplasmonic single molecule detection setup, the author observed red-shifts for low intensities within the WGM, and blue-shifts for high intensities. These measurements were then used to estimate the absorption cross-section of single molecules. The authors reported on the experimental investigation of seven molecules and complexes. They observed blue shifts for dye molecules, amino acids, and anomalous absorption of enzymes in the near-infrared spectral region. The optoplasmonic experiment is summarised in Figure 26. Figure 26a shows the optoplasmonic single-molecule sensor scheme, the experimental setup, and the resonance profiles together with their TOP shifts. Figure 26b shows the extinction spectrum of the GNR used in the experiments. Finally, Figure 26c shows the measured resonance wavelength under the attachment of 3-phosphoglycerate kinase (3PGK) molecules: one can observe red-shifts for low intensities into the WGM, and blue-shifts for high intensities. The same group has published very recently an optoplasmonic WGM sensor with DNA origami structures [106]. The origami structures are a scaffold for the precise assembly of plasmonic dimers (GNRs), which generate strong near-field enhancements in the nanogap between the them. The authors have thoroughly investigated the hybridization kinetics under varying environmental conditions such as salt concentration.
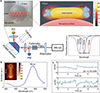 |
Figure 26 (a) Optoplasmonic single-molecule sensor scheme, experimental setup, and resonance profiles with shifts due to the TOP effect. (b) extinction spectrum of the GNR used in the experiments; (c) Examples of measured resonance wavelength under the attachment of 3-phosphoglycerate kinase (3PGK) molecules. Red and blue shifts are recorded for low and high intensities inside the WGM, respectively. Reproduced from [104]. |
Xu et al. [107] proposed a microbubble with GNRs adsorbed into the inner surface as a DNA sensor (see Figs. 27a and 27b). The authors detected DNA strands with a molecular weight of 8kDa in a volume of 10 pL. The authors used the interface mode, which enabled a detection limit as low as 0.3 pg/cm2 (see Fig. 27c).
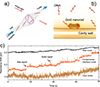 |
Figure 27 (a) Sketch of the microbottle, (b) Sketch of the GNR adsorbed into the inner surface of the microbottle, (c) Wavelength shift of the wall mode (black), the interface mode (orange) and the core mode (brown). Adapted from [107]. |
5.3 Physical sensors
The mode shift mechanism can be also applied for sensing physical parameters such as force, mass, pressure and temperature. Hollow polymeric microspheres [108] were first proposed as pressure sensors and then as force sensors [109]. In the case of MBRs, the first demonstration of force sensors was given by Sumetsky et al. [110]. In that paper, they tuned the MBR over one FSR by stretching it through a piezo-activated clamp, but they could not give an estimate of the applied force. In 2011, Henze et al. [111] demonstrated the possibility of tuning the resonances by changing the internal aerostatic pressure. Yang et al. [112] showed that the quasi-droplet regime for MBR gives the best sensing resolution. Lu et al. [113] proposed to use the internal aerostatic pressure sensing for measuring the thickness of the MBR wall. The authors obtained a sensitivity of 6.21 GHz/bar with standard error of 0.10 GHz/bar for a MBR wall thickness of 2.73 μm. Aymerich et al. have measured a similar sensitivity 9.99 GHz/bar for a wall thickness of 3.7 μm (see Fig. 28) [114].
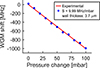 |
Figure 28 Frequency shift of a WGM versus internal pressure for a microbubble having a wall thickness of 3.7 μm. |
WGMRs are very sensitive to temperature and their sensitivity has been extensively studied over the years [115], mostly because it can be a serious hindrance especially in biosensing [116]. Two temperature related papers were published almost simultaneously by Guan et al. [117] and Brenci et al. [118]. Guan et al. measured the temperature changes in air and in water using a silica microsphere [117], whereas Brenci et al. [118] measured the optical shifts at room temperature and in a hot environment (around 54 °C). The authors measured a sensitivity of about 14.2 pm/°C, which is very close to the calculated one (13.5 pm/°C). Cosci et al. [119] proposed crystalline microdisks as THz detectors using the thermo-optical features of LN to design a bolometer with a NEP value of 9.66 nW Hz−1/2. Gagliardi et al. [120] reported on a silica microsphere based bolometer with a NEP value of 1 pW Hz−1/2. Hybrid WGMR [121] have been proposed to compensate the thermal shifts and also as humidity sensors [122, 123]. New interesting materials such as silk fibroin have been proposed as thermal sensors [124]. In 2019, Gu et al. [125] proposed a MBR filled with ethanol for temperature sensing. The authors measured a shift of almost 397 pm/°C and postulated that such a device could be used for measuring ocean temperature. Obviously, the device needs a strongly insulating packaging to work in a harsh environment and prevent water infiltrations and/or environmental pressure changes. Packaging the resonator and the coupler is also good option for thermally insulating the sensor [126–128].
Another way to reduce the thermal drift is resorting to self-referencing techniques such as mode splitting. Yang’s group reported on a nanoparticle-size spectrometry scheme for label-free real-time continuous detection and sizing of single Influenza A virions, polystyrene and GNRs using the mode splitting technique in a microtoroid [129]. However, back-scattered mode splitting is less effective when the goal is to detect multiple particles. Some authors have proposed the use of coupled cavities. In coupled cavities architectures, mode splitting is achieved by having a co-resonance [130]. Figure 29 shows the self-referencing optofluidic ring resonator (SR-OFRR) or coupled microbubbles. The authors demonstrated that their device lowered the noise by two orders of magnitude and detected BSA at 1 pg/mL. We remark that the device cannot be classified as a biosensor, since it does not have a BRE: the inner wall of OFRR 2 is silanized, but no specific element is used to recognize BSA.
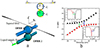 |
Figure 29 (a) Sketch of an SR-OFRR sensor. OFRR 1 is the reference resonator, while OFRR 2 is the sensing one. (b) Theoretical mode splitting for the coupled microbubble against resonance detuning. The red and black squares represent the left and right branches of the modes, respectively. Reprinted with permission from [130]. © 2013 American Chemical Society. |
5.4 Active sensing
Arnold et al. [69] reported on nanoparticle detection using the so-called WGM carousel trap. This light-induced trapping force provides a sensitive means for sizing individual particles and detecting their interactions close to the surface. The low power threshold of the effect (<200 μW) is due to the resonant build up in the cavity. Lopez et al. [131] proposed the WGMR carousel trap in coulometry. The carousel trap is used to first measure the cavity charge density and then the nanoparticle charge. Wang et al. [132] proposed an active sensor based on FRET to detect cell derived exosomes. The functionalization procedure is different from the most standard ones, since they relied on electrostatic interactions using poly-L-lysine (PLL), a layer of streptavidin (SA), and a biotinylated antibody to detect Nile Red (NR) labeled exosomes in a complex liquid matrix. The WGMR here is a Liquid Crystal (LC) microdroplet doped with C6 dye (green emission). Microdroplets, which act as microlasers, can flow in the liquid matrix due to intrinsic convection and Marangoni effect. Figure 30 shows the sensing mechanism of the self-propelled microlasers. The authors have demonstrated the powerful potential of their microlasers to identify specific exosomes at a level of 104 particles/μL. Their approach does not need removal of excessive background dyes, it can be extended to detect a wide range of cell-secreted molecules by choosing a specific surface functionalization of the microdroplet and the emission wavelength can be selected by changing the gain material in the LC microdroplet. Multiplexing is also possible due to the narrow linewidth of the laser emission. However, for in-vivo sensing applications, the LC used has to be changed to a biocompatible one.
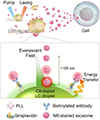 |
Figure 30 Sketch resuming the FRET sensing mechanism of a self-propelled microlaser. PLL: poly L-lysine, NR: Nile Red. Reprinted (adapted) with permission from [132]. © 2023 American Chemical Society. |
Sensing with active WGMR was proposed theoretically in 2006 by Yang and Guo [133]. The authors calculated a limit of detection (LOD) of active polymer microspheres to be 10−10 RIU. It was first demonstrated experimentally in 2008 [134] using quantum dot-embedded polystyrene microspheres for remote RI sensing and achieving an experimental sensitivity greater than the one predicted by Mie theory. In 2009, two different papers were published on the subject. Himmelhaus and François [135] demonstrated non-specific sensing using Nile-Red-doped polystyrene microspheres, whereas Beier et al. [136] proposed quantum-dot-embedded polystyrene microspheres for detecting selectively Thrombin. In 2015, Humar and Yun [137] demonstrated intracellular sensing by using WGMR based lasers. The authors proposed soft (natural lipid droplets) and hard (polystyrene spheres) WGMR to be injected into cells. Following the pioneering work of Himmelhaus and François [138], where the authors demonstrated that stressed induced changes in the cell deform the WGMR, Martino et al. observed the change in the lasing modes for rapid detection of numerous cells. Subsequently, the same group proposed silica-coated semiconductor microdisks as intracellular lasers [139]. The authors demonstrated real-time massive spectral detection of individual cells in a 3D tumour model over several days, and observed different behavioural phenotypes. The authors also observed that the far field emission was direction dependent, causing strong intensity fluctuations. To control the orientation inside the cell, the authors proposed the incorporation of light scatterers into the surface of the WGMR lasers, obtaining omnidirectional laser output. The omnidirectional WGMR laser within moving cells could be tracked continuously with high signal-to-noise ratios for 2 h, while conventional microlasers exhibited frequent signal loss causing tracking failure [140]. Schubert et al. proposed the WGMR lasers for all-optical recording of transient cardiac contraction profiles with cellular resolution [141]. The same group has recently published the protocol to integrate microlasers into living cells and to perform massive cellular tracking by means of hyperspectral confocal imaging [142]. In 2014, Yang’s group proposed an active detection scheme based on Raman lasing to detect single nanoparticles down to 10 nm in size [143] in a dry environment, whereas Li et al. [144] demonstrated the technique in both aqueous and dry environment with a similar LOD.
Several groups have been exploring new sensor architectures based on spectroscopic techniques for gas detection. Vahala’s group developed a soliton based dual comb spectroscopic technique using silica microtoroids [145]. Two microtoroids are used to generate two combs with slightly different repetition rates: one comb is used as a reference, whereas the other one goes through a gas cell. Then, both the reference arm and the sensing one are combined and the interferogram spectrum is observed. Yao’s group [146] coated asymmetrically a microsphere with graphene to generate different Stokes solitons, each of them belonging to different family modes. In this configuration the exfoliated graphene deposited on the surface only affects combs with large spatial distributions. The authors measured three beat signals through self-heterodyne detection and they were able to detect simultaneously ammonia, carbon dioxide, and water vapor at the picomolar per liter level in a mixture. The same group lowered the detection of ammonia, carbon dioxide and nitrogen dioxide down to 10ths of parts per trillion [15]. The authors were also able to identify multiple species in gas mixtures with an error below the 6%. Figure 31 show the conceptual working principle of the sensor.
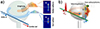 |
Figure 31 (a) Sketch of the microsphere with a flake of graphene placed at 30° angle from the equatorial plane. The hybrid WGMR is pumped by an external cavity diode laser (ECDL) that excites soliton combs, which belong to distinct mode families. Adapted from [146]. (b) Sketch of the Brillouin lasing device used for gas detection. BLs: Brillouin laser, PL: pump laser, Gr: Graphene. Adapted from [15]. |
5.5 Mechanical and photoacoustic sensing
Yang et al. [74] reported on a Brillouin lasing scheme for detecting optical, acoustic and micro waves. In this case, the authors used the Brillouin lasing shifts upon external stimulus such as radiation pressure, acoustic waves and microwave excitation. In this particular approach, the microsphere acts as a cantilever. This cantilever WGMR sensor detected a force of about 1.61 pN for 1 mW of external laser power; in the case of acoustic sensing the minimum detectable force is around 18 pN Hz−1/2. There are, however, some limitations for the simultaneous detection of three waves. The first limit is the use of modulated light, rather than continuous light, since the sensor is based on the oscillation from the cantilever-microsphere structure. The second limit is the amplitude variation of the Brillouin lasing caused by microwaves, since it can affect the amplitude of the light-actuation channel and the sound-actuation channel. Figure 32 shows the dual excitation of the microsphere-based cantilever and the spectra collected for different perturbations.
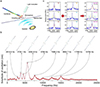 |
Figure 32 (a) Schematic illustration of the mechanical modes of the cantilever-microsphere structure, the tapered fiber injecting a temporally-modulated laser beam into the WGM, and an acoustic source. (b) Oscillation spectrum of different mechanical modes from the tapered fiber “string”: each mode has been verified by FEM. (c) Demonstration of the dual channel communications. Each row represents a combination of waves acting on the system (the magenta color represents the generating frequency). OM: optical modulation. AM: acoustic modulation. From [74]. |
Sun et al. [147] proposed an interesting approach to use a microsphere as an ultrasonic probe. The authors encapsulated a microsphere and a taper into an optical glue droplet, creating a compact and environmental robust probe for PA imaging. Figure 33 shows a sketch of the microsphere probe, the detection scheme and the PA image of a zebrafish. In this experiment, a pulsed laser source induces an ultrasound (US) wave in the blood vessels of the tissue, which is then detected by the WGMR-based probe. In terms of working principle, the US signal shifts the resonance by acting on the droplet-packaged system, and the readout of the resonance position reconstructs the typical PA oscillation.
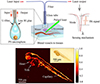 |
Figure 33 Top panel: sketch of the optical microcavity ultrasound probe and detection scheme. Bottom panel: PA image of a zebrafish. Adapted from [147]. |
Tang et al. [3] demonstrated the use of a microspherical WGMR as ultrasound sensor for real-time vibrational spectroscopy of single mesoscopic particles. The authors explored the feasibility of biomechanical fingerprinting of microbial cells. Three types of microorganism – the living cyanobacteria (Synechocystis sp. PCC6803), Aspergillus sydowii and Aspergillus niger spores were deposited on the surface of the WGMR and excited with a pulsed laser light. The cyanobacteria generated an US wave that shifted the resonance of the WGMR, allowing the readout.
Hollow resonators like MBR or quasi-suspended devices like microtoroids are more sensitive to deformations compared to solid microspheres. For this reason, they have been widely used as optomechanical and ultrasound sensors together with low-viscosity microdroplets [148]. Optomechanical studies in microtoroids are almost two decades old, Vahala’s group studied first the fundamental physics behind optomechanical oscillations (OMO) [17, 18, 149] and then Kippenberg proposed a microtoroid as a displacement sensor [150] with a shot-noise limited sensitivity of 10−19 mHz−1/2. In 2013, microtoroids and/or microdisks were also proposed as mass sensors [27] and managed to detect sub-pg masses by reading the shift of the oscillation frequency.
In 2019, Basiri-Esfahani et al. [151] achieved a noise-equivalent-pressure (NEP) between 8 and 300 μPa Hz−1/2 for frequencies from kHz to MHz with a dynamic range greater than 120 dB using a spoked silica microdisk. This kind of microdisks were first studied by Anetsberger [152]. Such a structure can boost the quality factor by an order of magnitude, reaching values of about 5 · 104. Some years later, Yang et al. [153] performed a more systematic study to optimize the device by varying the geometrical dimensions (namely the radius and the thickness) and using a trench structure around the microdisk. The best result was obtained for a microdisk with a radius of 300 μm and a thickness of 2 μm, resulting in sensitivity of 1.18 μPa Hz−1/2 at 82.6 kHz in air. Tamayo’s group [154] detected a single Staphylococcus epidermidis deposited on the surface of a microdisk by designing a device with eigenfrequencies close to the vibration frequencies of the bacteria. Sentre-Arribas et al. [155] detected temperature and relative humidity changes exploiting both optical and mechanical modes, reaching limit-of-detection (LOD) of 0.6 mK and 0.05% for an independent detection, whereas the LODs for an entangled detection were 1 mK and 1%.
5.6 Magnetometry
Another interesting sensing application is magnetometry. Microtoroids have mechanical oscillations in the MHz range, which makes them highly sensitive for magnetic resonance imaging (MRI). Instead, magnetic anomaly detection, magnetoencephalography (MEG) and mineral exploration need magnetometers with lower frequency range. Forstner et al. [156] demonstrated the first cavity magnetometer based on a microtoroid with a micrometric piece of Terfenol-D affixed to its top surface. The authors reported a peak sensitivity of 400 nT Hz−1/2. The same authors improved the device by embedding the material into the microtoroid in order to overcome the poor coupling between the affixed magnetostrictive material and the toroid. In this second paper [157], a sensitivity of 200pT Hz−1/2 was achieved in 100 kHz–MHz range (maximum bandwidth of 40 MHz), whereas in the range of 2 Hz–1 kHz the reported sensitivity was 150 nT Hz−1/2. The device was further optimised, first by improving the fabrication method [158] (see Fig. 34c) and then by improving the geometrical design to reach a sensitivity of 26 pT Hz−1/2 (see Fig. 34b) [159]. However, these results were obtained with advanced readout systems and highly controlled environment. Yang et al. [160] designed a robust polymer-packaged opto-mechanical magnetometer with microcavity readout, where the micromagnet was integrated into a soft polymer (see Fig. 34a). Their device worked in the hertz-to-kilohertz frequency range and achieved an improved sensitivity of 880 pT Hz−1/2 at 200 Hz. Another way to reach lower frequency detection is to use larger WGMR such as crystalline disks. Yu et al. [161] used a CaF2 WGMR with a diameter of about 16 mm with a Terfenol-D cylinder on top of it. The authors reported a sensitivity of 131 pT Hz−1/2 in a non-cryogenic environment without magnetical shielding (see Fig. 34d). MBR were also proposed as magnetometers by Freeman et al. [162]. The authors reported a sensitivity of 1.9 GHz/mT with a borosilicate MBR on chip.
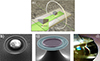 |
Figure 34 A series of WGMR-based magnetometers. (a) microtoroid with a microsized magnet encapsulated using poly(dimethylsiloxane), (b) microtoroid with an embedded Terfenol-D cylinder, (c) microtoroid with a thin film of Terfenol-D sputter coated on top, (d) a mm-size CaF2 microdisk resonator with a cylinder of Terfenol-D embedded inside. Adapted from [71]. |
5.7 Viscometry
Carmon et al. [163] pioneered the use of optomechanical oscillations and Brillouin lasing modes in MBRs for detecting viscosity. The authors measured the shift in the optomechanical modes in high density and high viscosity liquids, paving the way to the use of acoustic properties to characterise viscous biological fluids. One year later, Bahl et al. demonstrated an optomechanofluidic viscometer by using an MBR and measuring the line broadening of the mechanical mode [164]. The same group also developed a pressure sensor based on MBRs and demonstrated that it can work in harsh environment conditions, such as a high temperature environment. The pressure increment modifies geometrically the MBR (namely, increases the radius) which in turn modifies the mechanical and optical frequency of the MBR. The shift of the WGM resonance changes the coupled laser power and therefore the temperature of the cavity. Since the mechanical modulus depends on the temperature, the mechanical frequency also changes, in a self-sustained way.
As we mentioned in Section 4.4, Kim et al. [80] reached a NEP of 215 mPa Hz−1/2 and 41 mPa Hz−1/2 at 50 kHz and 800 kHz in air, using an hybrid approach. Tu et al. [165] have encapsulated the MBR and the taper to maintain stable performance under varying temperatures and static pressures. The authors detected acoustic waves at low frequencies in 10 Hz–100 kHz range, achieving a NEP of 2.2 mPa Hz−1/2.
5.8 Thermometry
Frigenti et al. have been studying extensively the use of MBR as US sensors, where the walls can serve as ultrasound transducers, while the hollow structure inside can act as a sample container [19, 166]. The first experiment [19] demonstrated the feasibility of the measurement, verified the transducer readings through the characterisation of a known PA agent and allowed to gain insight on the transduction mechanism, which is strongly influenced by the mechanical properties of the MBR. The second experiment [166], instead, challenged the MBR transducer through the characterisation of a constantly flowing and more diluted PA agent, simulating the configuration of a flow cytometry experiment. A sketch of the experimental set-up is shown in Figure 35. Our approach allows to avoid contact between the nanoparticle solution and the waveguide, and, with the implementation of a tunable excitation source, to reconstruct the absorption spectra of the nanoparticles. Our approach differs from the previous and pioneering results of Han et al. [167] and Ward et al. [168]. Han et al. used radiation pressure and Brilluoin scattering to activate the long range phonons and use the mechanical mode to sense different kinds of particles in the micrometric range in an open flow circuit. Ward et al. used a quasi droplet MBR to extend the optical mode deep inside the MBR and be able to sense nanoparticles using the optical shift without additional methods such as mode-locking or interferometry [169] or special lasers [170]. Frigenti et al. [166] were also able to detect 0.5 mM Au solution as the limit concentration in a flow-cytometry like configuration. Since the liquid flow caused an increased noise level in the time-domain read-out trace, the analysis moved to Fourier space exploiting the filtering action of the MBR mechanical modes. With this approach, signal-to-noise ratio (SNR) was greatly increased and the height of the most prominent peak was used as the measurement of the PA intensity. As in the first experiment [19], the PA response trend of the contrast agent was reconstructed and the LOD was estimated to be a 1 nM GNR concentration.
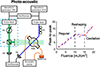 |
Figure 35 Left: sketch of the experimental setup used to demonstrate PA detection through a microbubble resonator. Right: PA response against excitation fluence measured through the MBR transducer for a GNRs colloidal solution. |
In these works, it has been demonstrated that the mechanical spectrum can be exploited as a filter to reduce the environmental noise. In addition, the extremely small volume, the direct implementation and the absence of an acoustic impedance-matching material are promising elements for wearable appliances and/or an endoscope. The applicability range of the MBR transducer extends beyond the medical area: in particular, applications in biology, material science and chemistry could benefit from its features. For example, the transducer could be used as a compact biosensor or as a gauge for development of new contrast agents. Additionally, the MBR would allow to interrogate the hosted material with an high repetition rate, ultimately limited by the decay time of the MBR mechanical modes. For the system here presented this limit is close to 40 kHz and would allow, for example, to track the evolution of a chemical reaction with a 25 μs time step by measuring the PA response of one reagent (e.g., growth of GNR, oxidation of the heme group).
Optothermal effects are ubiquitous in all kinds of WGMR and have been extensively studied in the last decade [129, 171]. These studies are mainly focused on the characterization and compensation of the optothermal effects of the cavity as a whole [172, 173], since the thermal shift of the WGMs is highly detrimental in label-free sensing approaches [116]. On the other hand, such extreme sensitivity can be used to develop efficient thermometers. Ultra high-Q microtoroids were the first WGMR transducer proposed to develop photothermal microscopy measurements of non-luminescent nano-objects such as carbon nanotubes [174], conductive polymers [175] and a single gold nanorod [67], even though the tuning range was quite small. These results were obtained in dry environment, which is not ideal in sensing applications [176]. For that reason, Goldsmith’s group in collaboration with Nic Chormaic’s group resorted to MBR and in combination with a double-modulation detection scheme. The groups measured the chemical etching dynamics of GNRs through polarization sensitive photothermal absorption microscopy [177]. Frigenti et al. proposed the MBRs for scattering-free absorption spectroscopy in an opaque medium like milk [178] and, after implementing a mode-locked technique, the LOD was calculated as a concentration of about 62pM GNRs [179]. Figure 36 shows the experimental set-up using a supercontinuum laser source for photothermal spectroscopy (Fig. 36a), together with the optical shifts recorded in an aqueous solution containing milk powder and GNRs (Fig. 36b). Figure 36c shows the absorption spectra normalized at the 740 nm values, together with a reference profile from a spectrophotometer (cyan curve).
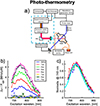 |
Figure 36 (a) Sketch of the experimental setup. MR: mirror, AL: aspherical lens, PD: photodiode, Pol.Con.: polarisation controller. (b) Power-normalized optical shifts for an aqueous solution containing GNRs (1.5 mM Au) and milk powder (1% w/w) (dots). The crosses refer to a solution with only the milk powder. (c) Same shift profiles normalized to their 740 nm values, together with a reference profile from a spectrophotometer (cyan curve). |
6 Conclusions
WGMR based devices are an ideal platform for sensing since they posses remarkable properties such as high quality factors and small mode volumes. In this review, we have described the most recent progress in the field, including the sensing principles, the WGMR fabrication and the coupling techniques. We have given an overview of different applications based either in optical or mechanical interactions. WGMR have a superior sensitivity, a broadband operation and low power consumption, unfortunately they are still lab-based sensors since all of them necessitate careful alignment. New approaches for having ready-to-use robust sensors are still needed to become real world devices.
Acknowledgments
Mr. Franco Cosi from IFAC-CNR is gratefully acknowledged for the manufacturing of the tapered fibers, crystaline microdisks and the active spheres shown in Figures 3, 4, 5, and 7. Dr. Romeo Bernini from CNR-IREA is gratefully acknowledged for providing pictures of the polymeric microbottles (Fig. 8).
Funding
D.F., S.P., G.N.C. and S.S.H. acknowledge the funding of the bilateral agreement CNR/CNPq (Brazil), Photothermal spectroscopy enhanced by polymeric optical microcavities (2025-2026). G.F. and S.S.H. acknowledge the support of the European Union – Next Generation EU, Mission 4 Component 2 Inv. 1.5 CUPB83C22003930001 (Tuscany Health Ecosystem, Spoke 4: Nanotechnologies for diagnosis and therapy).
Conflicts of interest
The authors declare that the research was conducted in the absence of any commercial or financial relationships that could be construed as a potential conflict of interest.
Data availablity statement
Data underlying the results presented in this paper are not publicly available at this time but may be obtained from the authors upon reasonable request.
Author contribution statement
All authors contributed to the article and approved the submitted version.
References
- Manohar S., Razansky D., Photoacoustics: a historical review, Adv. Opt. Photon. 8, 586 (2016). https://doi.org/10.1364/AOP.8.000586. [Google Scholar]
- Wissmeyer G, Pleitez MA, Rosenthal A, Ntziachristos V, Looking at sound: optoacoustics with all-optical ultrasound detection, Light. Sci. Appl. 7, 53 (2018). https://doi.org/10.1038/s41377-018-0036-7. [Google Scholar]
- Tang S.-J., Zhang M., Sun J., Meng J.-W., Xiong X., Gong Q., Jin D., Yang Q.-F., Xiao Y.-F., Single-particle photoacoustic vibrational spectroscopy using optical microresonators, Nat. Photon. 17, 951 (2023). https://doi.org/10.1038/s41566-023-01264-3. [Google Scholar]
- Boyd R, Nonlinear optics (Academic Press, New York, NY 2008). [Google Scholar]
- Frigenti G, Farnesi D, Nunzi Conti G, Soria S, Nonlinear optics in microspherical resonators, Micromachines 11, 303 (2020). https://doi.org/10.3390/mi110303036. [Google Scholar]
- Kozyreff G, Dominguez-Juarez JL, Martorell J, Nonlinear optics in spheres: from second harmonic scattering to quasi-phase matched generation in whispering gallery modes, Laser Photonics Rev. 5, 737 (2011). https://doi.org/10.1002/lpor.201000036. [Google Scholar]
- Lin G, Coillet A, Chembo Y-K, Nonliner phtonics with high-Q whsipering gallery mode resonators, Adv. Opt. Photon. 9, 828 (2017). https://doi.org/10.1364/AOP.9.000828. [Google Scholar]
- Frigenti G, Berneschi S, Farnesi D, Pelli S, Righini GC, Soria S, Dumeige Y, Féron P, Ristić D, Prudenzano F, Ferrari M, Nunzi Conti G, Rare earth-doped glass whispering gallery mode micro-lasers, Eur. Phys. J. Plus 138, 679 (2023). https://doi.org/10.1140/epjp/s13360-023-04275-9. [Google Scholar]
- Righini GC, Soria S, Biosensing by WGM micro spherical resonators, Sensors 16, 905 (2016). https://doi.org/10.3390/s16060905. [Google Scholar]
- Vollmer F, Arnold S, Whispering-gallery-mode biosensing: label-free detection down to single molecules, Nat. Methods 5, 591 (2008). https://doi.org/10.1038/nmeth.1221. [CrossRef] [Google Scholar]
- Peng B, Özdemir Ş, Lei F, Monifi F, Gianfreda M, Long GL, Fan S, Nori F, Bender CM, Yang L, Parity-time-symmetric whispering-gallery microcavities, Nat. Phys. 10, 394 (2014). https://doi.org/10.1038/nphys2927. [CrossRef] [Google Scholar]
- Kippenberg T, Spillane S, Vahala K, Kerr-nonlinearity optical parametric oscillation in an ultrahigh-Q toroid microcavity, Phys. Rev. Lett. 93, 083904 (2004). https://doi.org/10.1103/PhysRevLett.93.083904. [NASA ADS] [CrossRef] [Google Scholar]
- Fürst JU, Strekalov DV, Elser D, Aiello A, Andersen UL, Marquardt C, Leuchs G, Quantum light from a whispering-gallery-mode disk resonator, Phys. Rev. Lett. 106, 113901 (2011). https://doi.org/10.1103/PhysRevLett.106.113901. [Google Scholar]
- Aspelmeyer M, Kippenberg TJ, Marquardt F, Cavity optomechanics, Rev. Mod. Phys. 86, 1391 (2014). https://doi.org/10.1103/RevModPhys.86.1391. [Google Scholar]
- An N, Li Y, Zhang H, Liang Y, Tan T, Guo Y, Liu Z, Liu M, Guo Y, Wu Y, Peng B, Rao Y, Zhao G, Yao B, Brillouin lasers in a graphene microresonator for multispecies and individual gas molecule detection, APL Photonics 8, 100801 (2023). https://doi.org/10.1063/5.0164107. [Google Scholar]
- Rosello-Mecho X, Farnesi D, Frigenti G, Barucci A, Ratto F, Fernandez-Bienes A, Garcia-Fernandez T, Delgado-Pinar M, Andrés M, Nunzi Conti G, Soria S, Parametrical optomechanical oscillations in phoxonic whispering gallery mode resonators, Sci. Rep. 9, 7163 (2019). https://doi.org/10.1038/s41598-019-43271-x. [Google Scholar]
- Kippenberg TJ, Vahala KJ, Cavity optomechanics, Opt. Express 15, 17172 (2007). https://doi.org/10.1364/OE.15.017172. [Google Scholar]
- Carmon T, Rokhsari H, Yang L, Kippenberg TJ, Vahala KJ, Temporal behavior of radiation-pressure-induced vibrations of an optical microcavity phonon mode, Phys. Rev. Lett. 94, 223902 (2005). https://doi.org/10.1103/PhysRevLett.94.223902. [Google Scholar]
- Frigenti G, Cavigli L, Fernández-Bienes A, Ratto F, Centi S, García-Fernández T, Nunzi Conti G, Soria S, Resonant microbubble as a microfluidic stage for all-optical photoacoustic sensing, Phys. Rev. Appl. 12, 014062 (2019). https://doi.org/10.1103/PhysRevApplied.12.014062. [Google Scholar]
- Cosimo T, Long period fiber grating-based biosensing: recent trends and future perspectives, TrAC Trends Anal. Chem. 179, 117875 (2024). https://doi.org/10.1016/j.trac.2024.117875. [Google Scholar]
- Rayleigh L, The problem of the whispering gallery, Phil. Mag. 20, 1001 (1910). https://doi.org/10.1080/14786441008636993. [Google Scholar]
- Vahala KJ, Optical microcavities, Nature 424, 839 (2003). https://doi.org/10.1038/nature01939. [CrossRef] [PubMed] [Google Scholar]
- Righini G, Dumeige Y, Feron P, Ferrari M, Nunzi Conti G, Soria S, Ristiić D, Whispering gallery mode microresonators: fundamentals and applications, Riv. Nuovo Cimento 34, 435 (2011). https://doi.org/10.1393/ncr/i2011-10067-2. [Google Scholar]
- Chiasera A, Dumeige Y, Feron P, Ferrari M, Jestin Y, Nunzi Conti G, Pelli S, Soria S, Righini G, Spherical whispering-gallery-mode microresonators, Laser Photonics Rev. 4, 457 (2010). https://doi.org/10.1002/lpor.200910016. [Google Scholar]
- Ward J, Benson O, WGM microresonators: sensing, lasing and fundamental optics with microspheres, Laser Photonics Rev. 5, 553 (2011). https://doi.org/10.1002/lpor.201000025. [Google Scholar]
- Ward JM, Yang Y, Chormaic SN, Glass-on-glass fabrication of bottle-shaped tunable microlasers and their applications, Sci Rep 6, 25152 (2016). https://doi.org/10.1038/srep25152. [Google Scholar]
- Lu F, Alaie S, Leseman Z, Hossein-Zadeh M, Sub-pg mass sensing and measurement with an optomechanical sensor, Opt. Express 21, 19555 (2013). https://doi.org/10.1364/OE.21.019555. [Google Scholar]
- Ward JM, O’Shea DG, Shortt BJ, Morrissey MJ, Deasy K, Chormaic SGN, Heat-and-pull rig for fiber taper fabrication, Rev. Sci. Instrum. 77, 083105 (2006). https://doi.org/10.1063/1.2239033. [Google Scholar]
- Nunzi Conti G, Barucci A, Berneschi S, Brenci M, Cosi F, Farnesi D, Pelli S, Righini G, Soria S, Coupling approaches and new geometries in whispering-gallery-mode resonators, Proc. SPIE 8236, 82360V (2012). https://doi.org/10.1117/12.909596. [Google Scholar]
- Farnesi D, Chiavaioli F, Righini G, Soria S, Trono C, Jorge P, Nunzi Conti G, Long period grating-based fiber coupler to whispering gallery mode resonators, Opt. Lett. 39, 6525 (2014). https://doi.org/10.1364/OL.39.006525. [Google Scholar]
- Farnesi D, Chiavaioli F, Righini G, Soria S, Trono C, Baldini F, Trono C, Nunzi Conti G, Quasi distributed and wavelegnth selective addressing of optical microresonators base don long period fiber gratings, Opt. Express 23, 21175 (2015). https://doi.org/10.1364/OE.23.021175. [Google Scholar]
- Nunzi Conti G, Berneschi S, Cosi F, Pelli S, Soria S, Righini GC, Dispenza M, Secchi A, Planar coupling to high-Q lithium niobate disk resonators, Opt. Express 19, 3651 (2011). https://doi.org/10.1364/OE.19.003651. [Google Scholar]
- Soltani M, Ilchenko V, Matsko A, Savchenkov A, Schlafer J, Ryan C, Maleki L, Ultrahigh Q whispering gallery mode electro-optic resonators on a silicon photonic chip, Opt. Lett. 41, 4375 (2016). https://doi.org/10.1364/OL.41.004375. [Google Scholar]
- Zhuang Y, Kumazaki H, Fujii S, Imamura R, Daud NAB, Ishida R, Chen H, Tanabe T, Coupling of a whispering gallery mode to a silicon chip with photonic crystal, Opt. Lett. 44, 5731 (2019). https://doi.org/10.1364/OL.44.005731. [Google Scholar]
- Farnesi D, Pelli S, Soria S, Nunzi Conti G, Roux XL, Ballester MM, Vivien L, Cheben P, Alonso-Ramos C, Metamaterial engineered silicon photonic coupler for whispering gallery mode microsphere and disk resonators, Optica 8, 1511 (2021). https://doi.org/10.1364/OPTICA.438395. [Google Scholar]
- Ilchenko V, Yao X, Maleki L, Pigtailing the high-Q microsphere cavity: a simple fiber coupler for optical whispering-gallery modes, Opt. Lett. 24, 723 (1999). https://doi.org/10.1364/OL.24.000723. [Google Scholar]
- Farnesi D, Cosi F, Trono C, Righini GC, Nunzi Conti G, Soria S, Stimulated anti-Stokes Raman scattering resonantly enhanced in silica microspheres, Opt. Lett. 39, 5993 (2014). https://doi.org/10.1364/OL.39.005993. [Google Scholar]
- Farnesi D, Berneschi S, Cosi F, Righini G, Soria S, Nunzi Conti G, Stimulated stokes and antistokes raman scattering in microspherical whispering gallery mode resonators, J Vis Exp. 4, e53938 (2016). https://doi.org/10.3791/53938. [Google Scholar]
- Chang RK, Campillo AJ, Optical processes in microcavities (World Scientific, Singapore, 1996). [CrossRef] [Google Scholar]
- Lin H, Huston A, Justus B, Campillo A, Some characteristics of a droplet Whispering-Gallery-Mode laser, Opt. Lett. 11, 614 (1986). https://doi.org/10.1364/OL.11.000614. [Google Scholar]
- Foreman MR, Avino S, Zullo R, Loock H-P, Vollmer F, Gagliardi G, Enhanced nanoparticle detection with liquid droplet resonator, Eur Phys. J. Spec. Top. 223, 1971 (2014). https://doi.org/10.1140/epjst/e2014-02240-9. [Google Scholar]
- Maayani S, Martin LL, Carmon T, Water-walled microfluidics for high-optical finesse cavities, Nat. Commun. 7, 10435 (2016). https://doi.org/10.1038/ncomms10435. [Google Scholar]
- Sumetsky M, Whispering-gallery-bottle microcavities: the three-dimensional etalon, Opt. Lett. 29, 8 (2004). https://doi.org/10.1364/OL.29.000008. [Google Scholar]
- Sumetsky M, Dulashko Y, Windeler RS, Optical microbubble resonator, Opt. Lett. 35, 898 (2010). https://doi.org/10.1364/OL.35.000898. [Google Scholar]
- Grimaldi IA, Berneschi S, Testa G, Baldini F, Nunzi Conti G, Bernini R, Polymer based planar coupling of self-assembled bottle microresonators, Appl. Phys. Lett. 105, 231114 (2014). https://doi.org/10.1063/1.4904013. [Google Scholar]
- Gu G, Guo C, Cai Z, Xu H, Chen L, Fu H, Che K, Hong M, Sun S, Li F, Fabrication of ultraviolet-curable adhesive bottle-like microresonators by wetting and photocuring, Appl. Opt. 53, 7819 (2014). https://doi.org/10.1364/AO.53.007819. [Google Scholar]
- Amorim VA, Frigenti G, Baldini F, Berneschi S, Farnesi D, Jorge PAS, Maia JM, Conti GN, Santos PSSD, Marques PVS, Integrated all-in-silica optofluidic platform based on microbubble resonator and femtosecond laser written surface waveguide, IEEE Sens. J. 24, 25573 (2024). https://doi.org/10.1109/JSEN.2024.3418203. [Google Scholar]
- Berneschi S, Farnesi D, Cosi F, Nunzi Conti G, Pelli S, Righini GC, Soria S, High Q silica microbubble resonators fabricated by arc discharge, Opt. Lett. 36, 3521 (2011). https://doi.org/10.1364/OL.36.003521. [Google Scholar]
- Tachikura M, Fusion mass-splicing for optical fibers using electric discharges between two pairs of electrodes, Appl. Opt. 23, 492 (1984). https://doi.org/10.1364/AO.23.000492. [Google Scholar]
- Frigenti G, Arjmand M, Barucci A, Baldini F, Berneschi S, Farnesi D, Gianfreda M, Pelli S, Soria S, Aray A, Dumeige Y, Féron P, Conti GN, Coupling analysis of high Q resonators in add-drop configuration through cavity ringdown spectroscopy, J. Opt. 20, 065706 (2018). https://doi.org/10.1088/2040-8986/aac459. [Google Scholar]
- Armani DK, Kippenberg TJ, Spillane SM, Vahala KJ, Ultra-high-Q toroid microcavity on a chip, Nature 421, 925 (2003). https://doi.org/10.1038/nature01371. [CrossRef] [Google Scholar]
- Balac S, Féron P, Whispering gallery modes volume computation in optical micro-spheres, Technical report, FOTON, UMR CNRS 6082, 2014. [Google Scholar]
- Frigenti G, Ph.D. thesis, University of Florence, 2021. http://hdl.handle.net/2158/1237013 [Google Scholar]
- Guigot C, Leduc D, Lecieux Y, Classification of whispering gallery modes for cladded systems, Opt. Laser Technol. 174, 110572 (2024). https://doi.org/10.1016/j.optlastec.2024.110572. [Google Scholar]
- Palma G, Falconi C, Nazabal V, Yano T, Kishi T, Kumagai T, Ferrari M, Prudenzano F, Modeling of whispering gallery modes for rare earth spectroscopic characterization, IEEE Photonics Technol. Lett. 27, 1861 (2015). https://doi.org/10.1109/LPT.2015.2443915. [Google Scholar]
- Palma G, Falconi MC, Starecki F, Nazabal V, Yano T, Kishi T, Kumagai T, Prudenzano F, Novel double step approach for optical sensing via microsphere wgm resonance, Opt. Express 24, 26956 (2016). https://doi.org/10.1364/OE.24.026956. [Google Scholar]
- Teraoka I, Arnold S, Vollmer F, Perturbation approach to resonance shifts of whispering-gallery modes in a dielectric microsphere as a probe of a surrounding medium, J. Opt. Soc. Am. B 20, 1937 (2003). https://doi.org/10.1364/JOSAB.20.001937. [Google Scholar]
- Teraoka I, Arnold S, Theory of resonance shifts in TE and TM whispering gallery modes by nonradial perturbations for sensing applications, J. Opt. Soc. Am. B 23, 1381 (2006). https://doi.org/10.1364/JOSAB.23.001381. [Google Scholar]
- Yariv A, Yeh P, Photonics: optical electronics in modern communications (Oxford University Press, Oxford, UK, 2023). [Google Scholar]
- Louyer Y, Meschede D, Rauschenbeutel A, Tunable whispering-gallery-mode resonators for cavity quantum electrodynamics, Phys. Rev. A 72, 031801 (2005). https://doi.org/10.1103/PhysRevA.72.031801. [Google Scholar]
- Bianucci P, Optical microbottle resonators for sensing, Sensors 16, 1841 (2016). https://doi.org/10.3390/s16111841. [Google Scholar]
- Soria S, Berneschi S, Barucci A, Cosci A, Farnesi D, Nunzi Conti G, Pelli S, Righini G, In Glass Micro- and Nanospheres: Physics and Applications, edited by Righini G (Jenny Stanford Publishing, 2019), p. 165. [CrossRef] [Google Scholar]
- Pastells C, Marco P, Merino D, Loza-Alvarez P, Quercioli F, Pasquardini L, Lunelli L, Pederzolli C, Daldoso N, Farnesi D, Berneschi S, Righini GC, Nunzi Conti G, Soria S, Two photon versus one photon fluorescence excitation in whispering gallery mode microresonators, J. Lumin. 170, 860 (2016). https://doi.org/10.1016/j.jlumin.2015.07.013. [Google Scholar]
- Wang Y, Lang M, Lu J, Suo M, Du M, Hou Y, Wang X, Wang P, Demonstration of intracellular real-time molecular quantification via fret-enhanced optical microcavity, Nat Commun. 13, 6685 (2022). https://doi.org/10.1038/s41467-022-34547-4. [Google Scholar]
- Liu W, Chen YL, Tang S, Vollmer F, Xiao Y, Nonlinear sensing with whispering-gallery mode microcavities: from label-free detection to spectral fingerprinting, Nano Lett. 21, 1566 (2021). https://doi.org/10.1021/acs.nanolett.0c04090. [Google Scholar]
- Foreman MR, Jin WL, Vollmer F, Optimizing detection limits in whispering gallery mode biosensing, Opt. Express 22, 5491 (2014). https://doi.org/10.1364/OE.22.005491. [Google Scholar]
- Heylman KD, Thakkar N, Horak EH, Quillin SC, Cherqui C, Knapper KA, Masiello DJ, Goldsmith RH, Optical microresonators as single-particle absorption spectrometers, Nat. Photonics 10, 788 (2016). https://doi.org/10.1038/nphoton.2016.217. [Google Scholar]
- Sun Y, Shopova S, Frye-Mason G, Fan X, Rapid chemical-vapor sensing using optofluidic ring resonators, Opt. Lett. 33, 788 (2008). https://doi.org/10.1364/OL.33.000788. [Google Scholar]
- Arnold S, Keng D, Shopova SI, Holler S, Zurawsky W, Vollmer F, Whispering gallery mode carousel – a photonic mechanism for enhanced nanoparticle detection in biosensing, Opt. Express 17, 6230 (2009). https://doi.org/10.1364/OE.17.006230. [Google Scholar]
- Braginsky V, Manukin A, Tikhonov M, Investigation of dissipative ponderomotove effects of electromagnetic radiation, Sov. Phys. JETP 31, 829 (1970). [Google Scholar]
- Li B-B, Ou L, Lei Y, Liu Y-C, Cavity optomechanical sensing, Nanophotonics 10, 2799 (2021). https://doi.org/10.1515/nanoph-2021-0256. [Google Scholar]
- Yu W, Jiang W, Lin Q, Lu T, Cavity optomechanical spring sensing of single molecules, Nat. Commun. 7, 12311 (2016). https://doi.org/10.1038/ncomms12311. [Google Scholar]
- Tomes M, Carmon T, Photonic micro-electromechanical systems vibrating at X-band (11 ghz) rates, Phys. Rev. Lett 102, 113601 (2009). https://doi.org/10.1103/PhysRevLett.102.113601. [Google Scholar]
- Yang J, Qin T, Zhang F, Jiang XCX, Wan W, Multiphysical sensing of light, sound and microwave in a microcavity brillouin laser, Nanophotonics 9, 2915 (2020). https://doi.org/10.1515/nanoph-2020-0176. [Google Scholar]
- Giorgini A, Avino S, Malara P, Natale PD, Yannai M, Carmon T, Gagliardi G, Stimulated brillouin cavity optomechanics in liquid droplets, Phys. Rev. Lett. 120, 073902 (2018). https://doi.org/10.1103/PhysRevLett.120.073902. [Google Scholar]
- Giorgini A, Avino S, Malara P, Natale PD, Gagliardi G, Opto-mechanical oscillator in a nanoliter droplet, Opt. Lett. 43, 3473 (2018). https://doi.org/10.1364/OL.43.003473. [Google Scholar]
- Li J-J, Zhu K-D, Nonlinear optical mass sensor with an optomechanical microresonator, Appl. Phys. Lett. 101, 141905 (2012). https://doi.org/10.1063/1.4757004. [Google Scholar]
- Monifi F, Bo BP, Özdemir ŞK, Ma L, Maslov K, Wang LV, Yang L, in 2013 IEEE Photonics Conference, (IEEE, 2013), p. 215. https://doi.org/10.1109/IPCon.2013.6656511. [Google Scholar]
- Chistiakova MV, Armani AM, Photoelastic ultrasound detection using ultra-high-q silica optical resonators, Opt. Express 22, 28169 (2014). https://doi.org/10.1364/OE.22.028169. [Google Scholar]
- Kim K, Luo W, Zhang C, Tian C, Guo LJ, Wang X, Fan X, Air-coupled ultrasound detection using capillary-based optical ring resonators, Sci. Rep. 7, 109 (2017). https://doi.org/10.1038/s41598-017-00134-7. [Google Scholar]
- Griffel G, Arnold S, Taskent D, Serpenguzel A, Connolly J, Morris N, Morphology-dependent resonances of a microsphere-optical fiber system, Opt. Lett. 21, 695 (1996). https://doi.org/10.1364/OL.21.000695. [Google Scholar]
- Arnold S, Khoshsima M, Teraoka I, Holler S, Vollmer F, Shift of whispering gallery modes in microspheres by protein adsorption, Opt. Lett. 28, 272 (2003). https://doi.org/10.1364/OL.28.000272. [Google Scholar]
- Hanumegowda NM, Stica CJ, Patel BC, White IM, Fan X, Refractometric sensors based on microsphere resonators, Appl. Phys. Lett. 87, 201107 (2005). https://doi.org/10.1063/1.2132076. [Google Scholar]
- Armani A, Vahala KJ, Heavy water detection using ultra-high-q microcavities, Opt. Lett. 31, 896 (2006). https://doi.org/10.1364/OL.31.001896. [Google Scholar]
- Zamora V, Díez A, Andrés MV, Gimeno B, Refractometric sensor based on whispering gallery modes of thin capillaries, Opt. Express 15, 12011 (2007). https://doi.org/10.1364/OE.15.012011. [Google Scholar]
- Sumetsky M, Windeler RS, Dulashko Y, Fan X, Optical liquid ring resonator sensor, Optics Express 15, 14376 (2007). https://doi.org/10.1364/OE.15.014376. [Google Scholar]
- Sedlmeir F, Zeltner R, Leuchs G, Schwefel HG, High-Q MgF2 whispering gallery mode resonators for refractometric sensing in aqueous environment, Opt. Express 22, 30934 (2014). https://doi.org/10.1364/OE.22.030934. [Google Scholar]
- Soria S, Berneschi S, Brenci M, Cosi F, Nunzi Conti G, Pelli S, Righini GC, Optical microspherical resonators for biomedical sensing, Sensors 11, 785 (2011). https://doi.org/10.3390/s110100785. [Google Scholar]
- Foreman MR, Swaim JD, Vollmer F, Whispering gallery mode sensors, Adv. Opt. Photonics 7, 168 (2015). https://doi.org/10.1364/AOP.7.000168. [Google Scholar]
- Cai L, Pan J, Zhao Y, Wang J, Xiao S, Whispering gallery mode optical microresonators: Structures and sensing applications, Phys. Status Solidi A 217, 1900825 (2020). https://doi.org/10.1002/pssa.201900825. [Google Scholar]
- Pasquardini L, Berneschi S, Barucci A, Cosi F, Dallpiccola R, Lunelli L, Nunzi Conti L, Pederzolli C, Soria S, Whispering gallery modes aptasensors for detection of blood proteins, J. Biophotonics 6, 785 (2013). https://doi.org/10.1002/jbio.201200013. [Google Scholar]
- Ren H-C, Vollmer F, Arnold S, Libchaber A, High-Q microsphere biosensor – analysis for adsorption of rodlike bacteria, Opt. Express 15, 17410 (2007). https://doi.org/10.1364/OE.15.017410. [Google Scholar]
- Arnold S, Ramjit R, Keng D, Kolchenko V, Teraoka I, Microparticle photophysics illuminates viral bio-sensing, Faraday Discuss. 137, 65 (2008). https://doi.org/10.1039/B702920A. [Google Scholar]
- Vollmer F, Arnold S, Keng D, Single virus detection from the reactive shift of a whispering-gallery mode, Proc. Natl. Acad. Sci. USA 105, 20701 (2008). https://doi.org/10.1073/pnas.0808988106. [Google Scholar]
- Noto M, Keng D, Teraoka I, Arnold S, Detection of protein orientation on the silica microsphere surface using transverse electric/transverse magnetic whispering gallery modes, Biophys. J. 92, 4466 (2007). https://doi.org/10.1529/biophysj.106.103200. [Google Scholar]
- Topolancik J, Vollmer F, Photoinduced transformations in bacteriorhodopsin membrane with optical microcavities, Biophys. J. 92, 2223 (2007). https://doi.org/10.1529/biophysj.106.098806. [Google Scholar]
- Giannetti A, Berneschi S, Baldini F, Cosi F, Nunzi Conti G, Soria S, Performance of eudragit coated whispering gallery mode resonator-based immunosensors, Sensors 12, 14604 (2012). https://doi.org/10.3390/s121114604. [Google Scholar]
- Zhu H, Suter JD, White IM, Fan X, Aptamer based microsphere biosensor for thrombin detection, Sensors 6, 785 (2006). https://doi.org/10.3390/s6080785. [Google Scholar]
- Berneschi S, Baldini F, Cosci A, Cosi F, Farnesi D, Nunzi Conti G, Tombelli S, Trono C, Pelli S, Giannetti A, Fluorescence biosensing in selectively photo-activated microbubble resonators, Sens. Actuators B Chem. 242, 1057 (2017). https://doi.org/10.1016/j.snb.2016.09.146. [Google Scholar]
- Berneschi S, Baldini F, Barucci A, Cosci A, Cosi F, Farnesi D, Nunzi Conti G, Righini GC, Soria S, Tombelli S, Trono C, Pelli S, Giannetti A, Localized biomolecules immobilization in optical microbubble resonators, Proc. SPIE 9727, 972719 (2016). https://doi.org/10.1117/12.2213683. [Google Scholar]
- Dantham VR, Holler S, Kolchenko V, Wan Z, Arnold S, Taking whispering gallery-mode single virus detection and sizing to the limit, Appl. Phys. Lett 101, 043704 (2012). https://doi.org/10.1063/1.4739473. [Google Scholar]
- Dantham VR, Holler S, Barbre C, Keng D, Kolchenko V, Arnold S, Label-free detection of single protein using a nanoplasmonic-photonic hybrid microcavity, Nano Lett. 13, 3347 (2013). https://doi.org/10.1021/nl401633y. [Google Scholar]
- Subramanian S, Jones HB, Frustaci S, Winter S, van der Kamp MW, Arcus VL, Pudney CR, Vollmer F, Sensing enzyme activation heat capacity at the single-molecule level using gold-nanorod-based optical whispering gallery modes, ACS Appl. Nano Mater. 4, 4576 (2021). https://doi.org/10.1021/acsanm.1c00176. [Google Scholar]
- Toropov NA, Houghton MC, Yu D, Vollmer F, Thermo-optoplasmonic single-molecule sensing on optical microcavities, ACS Nano 18, 17534 (2024). https://doi.org/10.1021/acsnano.4c00877. [Google Scholar]
- Houghton MC, Toropov NA, Yu D, Bagby S, Vollmer F, Single molecule thermodynamic penalties applied to enzymes by whispering gallery mode biosensors, Adv. Sci. 11, 2403195 (2024). https://doi.org/10.1002/advs.202403195. [Google Scholar]
- Ghamari S, Chiarelli G, Kolataj K, Subramanian S, Acuna GP, Vollmer F, Label-free (fluorescence-free) sensing of a single DNA molecule on DNA origami using a plasmon-enhanced WGM sensor, Nanophotonics 14, 253 (2025). https://doi.org/10.1515/nanoph-2024-0560. [Google Scholar]
- Yu X, Tang S-J, Liu W, Xu Y, Gong Q, Chen Y-L, Xiao Y-F, Single-molecule optofluidic microsensor with interface whispering gallery modes, Proc. Natl. Acad. Sci. USA 6, 119 (2022). https://doi.org/10.1073/pnas.2108678119. [Google Scholar]
- Ioppolo T, Otugen MV, Pressure tuning of whispering gallery mode resonators, J. Opt. Soc. Am. B 24, 2721 (2007). https://doi.org/10.1364/JOSAB.24.002721. [Google Scholar]
- Ioppolo T, Kozhevnikov M, Stepaniuk V, Otugen M, Sheverev V, Micro-optical force sensor concept based on whispering gallery mode resonators, Appl. Opt. 47, 3009 (2008). https://doi.org/10.1364/AO.47.003009. [Google Scholar]
- Sumetsky M, Dulashko Y, Windeler RS, Super free spectral range tunable optical microbubble resonator, Opt. Lett 35, 1866 (2010). https://doi.org/10.1364/OL.35.001866. [Google Scholar]
- Henze R, Seifert T, Ward J, Benson O, Tuning whispering gallery modes using internal aerostatic pressure, Opt. Lett. 36, 4536 (2011). https://doi.org/10.1364/OL.36.004536. [Google Scholar]
- Yang Y, Ward J, Chormaic SN, Quasi-droplet microbubbles for high resolution sensing applications, Opt. Express 22, 6881 (2014). https://doi.org/10.1364/OE.22.006881. [Google Scholar]
- Lu Q, Liao J, Liu S, Wu X, Liying Liu ALX, Precise measurement of micro bubble resonator thickness by internal aerostatic pressure sensing, Opt. Express 24, 20855 (2016). https://doi.org/10.1364/OE.24.020855. [Google Scholar]
- Aymerich M, Frigenti G, Farnesi D, Cosci A, Cerminara M, Pelli S, Righini GC, Nunzi Conti G, Flores-Arias MT, Soria S, in Advanced Photonics 2018 (BGPP, IPR, NP, NOMA, Sensors, Networks, SPPCom, SOF) (OSA Technical Digest, 2018), p. SeW2E.6. https://doi.org/10.1364/SENSORS.2018.SeW2E.6. [CrossRef] [Google Scholar]
- Ward J, Dhasmana N, Chormaic SN, Hollow core, whispering gallery resonator sensors, Eur. Phys. J. Spec. Top. 223, 1917 (2014). https://doi.org/10.1140/epjst/e2014-02236-5. [Google Scholar]
- Arnold S, Shopova S, Holler S, Whispering gallery mode bio-sensor for label-free detection of single molecules: thermo-optic vs. reactive mechanism, Opt. Express 18, 281 (2010). https://doi.org/10.1364/OE.18.000281. [Google Scholar]
- Guan G, Arnold S, Ötügen MV, Temperature measurements using a microoptical sensor based on whispering gallery modes, AIAA J. 44, 2385 (2006). https://doi.org/10.2514/1.20910. [Google Scholar]
- Brenci M, Calzolai M, Cosi F, Nunzi Conti G, Pelli S, Righini G, Microspherical resonators for biophotonic sensors, Proc. SPIE 6158, 61580S (2006). https://doi.org/10.1117/12.675800. [Google Scholar]
- Cosci A, Cerminara M, Nunzi Conti G, Soria S, Righini G, Pelli S, THZ pyro-optical detector based on linbo3 whispering gallery mode microdisc resonato, Sensors 17, 258 (2017). https://doi.org/10.3390/s17020258. [Google Scholar]
- D’Ambrosio D, Capezzuto M, Aiello R, Santi MGD, Sorgi A, Malara P, Avino S, Giorgini A, Maddaloni P, Consolino L, Vitiello MS, Natale PD, Gagliardi G, Infrared-to-THZ detection and spectroscopy with whispering-gallery-mode microresonators, Adv. Photonics Res. 3, 2200147 (2022). https://doi.org/10.1002/adpr.202200147. [Google Scholar]
- Dong CH, He L, Xiao Y-F, Gaddam VR, Özdemir ŞK, Han Z-F, Guo G-C, Yang L, Fabrication of high-Q polydimethylsiloxane optical microspheres for thermal sensing, Appl. Phys. Lett. 94, 231119 (2009). https://doi.org/10.1063/1.3152791. [Google Scholar]
- Mehrabani S, Kwong P, Gupta M, Armani AM, Hybrid microcavity humidity sensor, Appl. Phys. Lett. 102, 241101 (2013). https://doi.org/10.1063/1.4811265. [Google Scholar]
- Petermann AB, Varkentin A, Roth B, Morgner U, Meinhardt-Wollweber M, All-polymer whispering gallery mode sensor system, Opt. Express 24, 6052 (2016). https://doi.org/10.1364/OE.24.006052. [Google Scholar]
- Xu L, Jiang X, Zhao G, Ma D, Tao H, Liu Z, Omenetto FG, Yang L, High-Q silk fibroin whispering gallery microresonator, Opt. Express 24, 20825 (2016). https://doi.org/10.1364/OE.24.020825. [Google Scholar]
- Gu G, Jiang J, Wang S, Liu K, Zhang Y, Ding Z, Highly sensitive temperature sensor based on hollow microsphere for ocean application, IEEE Photonics J. 11, 6803508 (2019). https://doi.org/10.1109/JPHOT.2019.2950028. [Google Scholar]
- Tang T, Wu X, Liu L, Xu L, Packaged optofluidic microbubble resonators for optical sensing, Appl. Opt. 55, 395 (2016). https://doi.org/10.1364/AO.55.000395. [Google Scholar]
- Yan Y-Z, Zou C-L, Yan S-B, Sun F-W, Ji Z, Liu J, Zhang Y-G, Wang L, Xue C-Y, Zhang W-D, Han Z-F, Xiong J-J, Packaged silica microsphere-taper coupling system for robust termal sensing applications, Opt. Express 19, 5753 (2011). https://doi.org/10.1364/OE.19.005753. [Google Scholar]
- Cosci A, Berneschi S, Giannetti A, Farnesi D, Cosi F, Baldini F, Gualtiero N, Soria S, Barucci A, Righini G, Pelli S, Resonance frequency of optical microbubble resonators: direct measurements and mitigation of fluctuations, Sensors 16, 1405 (2016). https://doi.org/10.3390/s16091405. [Google Scholar]
- Zhu J, Özdemir ŞK, He L, Chen D-R, Yang L, Single virus and nanoparticle size spectrometry by whispering-gallery-mode microcavities, Opt. Express 19, 16195 (2011). https://doi.org/10.1364/OE.19.016195. [Google Scholar]
- Li M, Wu X, Liu L, Fan X, Xu L, Self-referencing optofluidic ring resonator sensor for highly sensitive biomolecular detection, Anal. Chem. 85, 9328 (2013). https://doi.org/10.1021/ac402174x. [Google Scholar]
- Lopez JR, Treasurer E, Snyder KM, Keng D, Arnold S, Whispering gallery mode coulometry of the nanoparticle-microcavity interaction in aqueous solution, Appl. Phys. Lett. 112, 051109 (2018). https://doi.org/10.1063/1.5017041. [Google Scholar]
- Wang Z, Fang G, Gao Z, Liao Y, Gong C, Kim M, Chang G, Feng S, Xu T, Liu T, Chen Y, Autonomous microlasers for profiling extracellular vesicles from cancer spheroids, Nano Lett. 23, 2502 (2023). https://doi.org/10.1021/acs.nanolett.2c04123. [Google Scholar]
- Yang J, Guo L, Optical sensors based on active microcavities, IEEE J. Sel. Top. Quantum Electron. 12, 143 (2006). https://doi.org/10.1109/JSTQE.2005.862953. [Google Scholar]
- Pang S, Beckham R, Meissner KE, Quantum dot-embedded microspheres for remote refractive index sensing, Appl. Phys. Lett. 92, 221108 (2008). https://doi.org/10.1063/1.2937209. [Google Scholar]
- Himmelhaus M, François A, Whispering gallery mode biosensor operated in the stimulated emission regime, Appl. Phys. Lett. 94, 031101 (2009). https://doi.org/10.1063/1.3059573. [Google Scholar]
- Beier H, Cote G, Meissner K, Whispering gallery mode biosensors consisting of quantum dot-embedded microspheres, Ann. Biomed. Eng. 37, 1974 (2009). https://doi.org/10.1007/s10439-009-9713-2. [Google Scholar]
- Humar M, Yun SH, Intracellular microlasers, Nat. Photonics 9, 572 (2015). https://doi.org/10.1038/NPHOTON.2015.129. [CrossRef] [PubMed] [Google Scholar]
- Himmelhaus M, François A, In vitro sensing of biomechanical forces in live cells by a whispering gallery mode biosensor, Biosens. Bioelectron 25, 418 (2009). https://doi.org/10.1016/j.bios.2009.07.021. [Google Scholar]
- Martino N, Kwok SJJ, Liapis AC, Forward S, Jang H, Kim HM, Wu SJ, Wu J, Dannenberg PH, Jang SJ, Lee YH, Yun SH, Wavelength-encoded laser particles for massively multiplexed cell tagging, Nat. Photonics 13, 720 (2019). https://doi.org/10.1038/s41566-019-0489-0. [Google Scholar]
- Tang S-J, Dannenberg PH, Liapis AC, Martino N, Zhuo Y, Xiao Y-F, Yun S-H, Laser particles with omnidirectional emission for cell tracking, Light Sci. Appl. 10, 23 (2021). https://doi.org/10.1038/s41377-021-00466-0. [Google Scholar]
- Schubert M, Woolfson L, Barnard IRM, Dorward AM, Casement B, Morton A, Robertson GB, Appleton PL, Miles GB, Tucker CS, Pitt SJ, Gather MC, Monitoring contractility in cardiac tissue with cellular resolution using biointegrated microlasers, Nat. Photonics 14, 452 (2020). https://doi.org/10.1038/s41566-020-0631-z. [CrossRef] [Google Scholar]
- Titze VM, Caixeiro S, Dinh VS, König M, Rübsam M, Pathak N, Schumacher A-L, Germer M, Kukat C, Niessen CM, Schubert M, Gather MC, Hyperspectral confocal imaging for high-throughput readout and analysis of bio-integrated microlasers, Nat. Protoc. 19, 928 (2024). https://doi.org/10.1038/s41596-023-00924-6. [Google Scholar]
- Özdemir ŞK, Zhu J, Yang X, Peng B, Yilmaz H, He L, Monifi F, Huang S, Long G, Yang L, Highly sensitive detection of nanoparticles with a self-referenced and self-heterodyned whispering-gallery raman microlaser, Proc. Natl. Acad. Sci. USA 111, e3836 (2014). https://doi.org/10.1073/pnas.140828311. [Google Scholar]
- Li B-B, Clements W, Yu X-C, Shi K, Gong Q, Xiao Y-F, Single nanoparticle detection using split-mode microcavity raman lasers, Proc. Natl. Acad. Sci. USA 111, 14657 (2014). https://doi.org/10.1073/pnas.1408453111. [Google Scholar]
- Suh M-G, Yang Q-F, Yang K, Yi X, Vahala K, Microresonator soliton dual-comb spectroscopy, Science 354, 600 (2016). https://doi.org/10.1126/science.aah6516. [Google Scholar]
- Tan T, Yuan Z, Zhang H, Yan G, Zhou S, An N, Peng B, Soavi G, Rao Y, Yao B, Multispecies and individual gas molecule detection using stokes solitons in a graphene over-modal microresonator, Nat. Commun. 12, 6716 (2021). https://doi.org/10.1038/s41467-021-26740-8. [Google Scholar]
- Sun J, Tang S-J, Meng J-W, Li C, Whispering-gallery optical microprobe for photoacoustic imaging, Photonics Res. 11, A65 (2023). https://doi.org/10.1364/PRJ.495267. [Google Scholar]
- D’Ambrosio D, Capezzuto M, Avino S, Malara P, Giorgini A, Natale PD, Gagliardi G, Light pressure in droplet micro-resonators excited by free-space scattering, Opt. Lett. 46, 3111 (2021). https://doi.org/10.1364/OL.427260. [Google Scholar]
- Kippenberg T, Rokhsari H, Carmon T, Scherer A, Vahala KJ, Analysis of radiation-pressure induced mechanical oscillation of an optical microcavity, Phys. Rev. Lett. 95, 033901 (2005). https://doi.org/10.1103/PhysRevLett.95.033901. [Google Scholar]
- Schliesser A, Anetsberger G, Rivière R, Arcizet O, Kippenberg TJ, High-sensitivity monitoring of micromechanical vibration using optical whispering gallery mode resonators, New J. Phys. 10, 095015 (2008). https://doi.org/10.1088/1367-2630/10/9/095015. [Google Scholar]
- Basiri-Esfahani S, Armin A, Forstner S, Bowen WP, Precision ultrasound sensing on a chip, Nat. Commun. 10, 132 (2019). https://doi.org/10.1038/s41467-018-08038-4. [Google Scholar]
- Anetsberger G, Rivière R, Schliesser A, Arcizet O, Kippenberg TJ, Ultralow-dissipation optomechanical resonators on a chip, Nat. Photon 2, 627 (2008). https://doi.org/10.1038/nphoton.2008.199. [Google Scholar]
- Yang H, Cao X, Hu Z-G, Gao Y, Lei Y, Wang M, Zuo Z, Xu X, Li B-B, Micropascal-sensitivity ultrasound sensors based on optical microcavities, Photon. Res. 11, 1139 (2023). https://doi.org/10.1364/PRJ.486849. [Google Scholar]
- Gil-Santos E, Ruz J, Malvar O, Favero I, Lemaître A, Kosaka P, Lopez SG, Calleja M, Tamayo J, Optomechanical detection of vibration modes of a single bacterium, Nat Nanotechnol. 15, 469 (2020). https://doi.org/10.1038/s41565-020-0672-y. [Google Scholar]
- Sentre-Arribas E, Aparicio-Millán A, Lemaître A, Favero I, Tamayo J, Calleja M, Gil-Santos E, Simultaneous optical and mechanical sensing based on optomechanical resonators, ACS Sens. 9, 371 (2024). https://doi.org/10.1021/acssensors.3c02103. [Google Scholar]
- Forstner S, Prams S, Knittel J, van Ooijen ED, Swaim J, Harris G, Szorkovszky A, Bowen W, Rubinsztein-Dunlop H, Cavity optomechanical magnetometer, Phys. Rev. Lett. 108, 120801 (2012). https://doi.org/10.1103/PhysRevLett.108.120801. [Google Scholar]
- Forstner S, Sheridan E, Knittel J, Humphreys C, Brawley G, Rubinsztein-Dunlop H, Bowen W, Ultrasensitive optomechanical magnetometry, Adv. Mater. 26, 6348 (2014). https://doi.org/10.1002/adma.201401144. [Google Scholar]
- Li B-B, Bulla D, Prakash V, Forstner S, Dehghan-Manshadi A, Rubinsztein-Dunlop H, Foster S, Bowen WP, Invited article: scalable high-sensitivity optomechanical magnetometers on a chip, APL Photonics 3, 120806 (2018). https://doi.org/10.1063/1.5055029. [Google Scholar]
- Li B-B, Brawley G, Greenall H, Forstner S, Sheridan E, Rubinsztein-Dunlop H, Bowen WP, Ultrabroadband and sensitive cavity optomechanical magnetometry, Photon. Res. 8, 1064 (2020). https://doi.org/10.1364/PRJ.390261. [Google Scholar]
- Zhu J, Zhao G, Savukov I, Yang L, Polymer encapsulated microcavity optomechanical magnetometer, Sci. Rep. 7, 8896 (2017). https://doi.org/10.1038/s41598-017-08875-1. [Google Scholar]
- Yu C, Janousek J, Sheridan E, McAuslan DL, Rubinsztein-Dunlop H, Lam PK, Zhang Y, Bowen WP, Optomechanical magnetometry with a macroscopic resonator, Phys. Rev. Appl. 5, 044007 (2016). https://doi.org/10.1103/PhysRevApplied.5.044007. [Google Scholar]
- Freeman E, Wang C-Y, Sumaria V, Zhang C, Cocking A, Liu Z, Tadigadapa Sin: 2017 IEEE Sensors (IEEE, 2017), p. 1. https://doi.org/10.1109/ICSENS.2017.8233893. [Google Scholar]
- Bahl G, Kim K, Lee W, Liu J, Fan X, Carmon T, Brillouin cavity optomechanics with microfluid devices, Nat. Commun. 4, 1994 (2013). https://doi.org/10.1038/ncomms2994. [Google Scholar]
- Han K, Zhu K, Bahl G, Opto-mechano-fluidic viscometer, Appl. Phys. Lett. 105, 014103 (2014). https://doi.org/10.1063/1.4887369. [Google Scholar]
- Tu X, Wang Y, Guo Z, Chen Z, Huang T, Wu X, Luoi W, Underwater acoustic wave detection based on packaged optical microbubble resonator, J. Lightwave Technol. 40, 6272 (2022). https://doi.org/10.1109/JLT.2022.3187960. [Google Scholar]
- Frigenti G, Cavigli L, Fernández-Bienes A, Ratto F, Centi S, García-Fernández T, Nunzi Conti G, Soria S, Microbubble resonators for all-optical photoacoustics of flowing contrast agents, Sensors 20, 1696 (2020). https://doi.org/10.3390/s20061696. [CrossRef] [PubMed] [Google Scholar]
- Han K, Kim J, Bahl G, High-throughput sensing of freely flowing particles with optomechanofluidics, Optica 3, 585 (2016). https://doi.org/10.1364/OPTICA.3.000585. [Google Scholar]
- Ward JM, Yang Y, Lei F, Yu X-C, Xiao Y-F, Chormaic SN, Nanoparticle sensing beyond evanescent field interaction with a quasi-droplet microcavity, Optica 5, 674 (2018). https://doi.org/10.1364/OPTICA.5.000674. [Google Scholar]
- Knittel J, McRae TG, Lee KH, Bowen WP, Interferometric detection of mode splitting for whispering gallery mode biosensors, Appl. Phys. Lett. 97, 123704 (2010). https://doi.org/10.1063/1.3494530. [Google Scholar]
- Shopova SI, Rajmangal R, Nishida Y, Arnold S, Ultrasensitive nanoparticle detection using a portable whispering gallery mode biosensor driven by a periodically poled lithium-niobate frequency doubled distributed feedback laser, Rev. Sci. Instrum. 81, 103110 (2010). https://doi.org/10.1063/1.3499261. [Google Scholar]
- Chen W, Zhu J, Özdemir SK, Peng B, Yang L, A simple method for characterizing and engineering thermal relaxation of an optical microcavity, Appl. Phys. Lett. 109, 061103 (2016). https://doi.org/10.1063/1.4960665. [Google Scholar]
- He L, Xiao F, Dong C, Zhu J, Gaddam V, Yang L, Compensation of thermal refraction effect in high-Q toroidal microresonator by polydimethylsiloxane coating, Appl.Phys. Lett. 93, 201102 (2008). https://doi.org/10.1063/1.3030986. [Google Scholar]
- He L, Xiao Y-F, Zhu J, Özdemir ŞK, Yang L, Oscillatory thermal dynamics in high-Q PDMS coated silica toroidal microresonators, Opt. Express 17, 9571 (2009). https://doi.org/10.1364/oe.17.009571. [Google Scholar]
- Heylman KD, Knapper KA, Goldsmith RH, Photothermal microscopy of nonluminescent single particles enabled by optical microresonators, J. Phys. Chem. Lett. 5, 1917 (2014). https://doi.org/10.1021/jz500781g. [Google Scholar]
- Horak EH, Rea MT, Heylman KD, Gelbwaser-Klimovsky D, Saikin SK, Thompson BJ, Kohler DD, Knapper KA, Wei W, Pan F, Gopalan P, Wright JC, Aspuru-Guzik A, Goldsmith RH, Exploring electronic structure and order in polymers via single-particle microresonator spectroscopy, Nano Lett. 5, 1600 (2018). https://doi.org/10.1021/acs.nanolett.7b04211. [Google Scholar]
- Berneschi S, Bettazzi F, Giannetti A, Baldini F, Nunzi Conti G, Pelli S, Palchetti I, Optical whispering gallery mode resonators for label-free detection of water contaminants, Trends Anal. Chem. 126, 115856 (2020). https://doi.org/10.1016/j.trac.2020.115856. [Google Scholar]
- Hogan LT, Horak EH, Ward JM, Knapper KA, Chormaic SN, Goldsmith RH, Toward real-time monitoring and control of single nanoparticle properties with a microbubble resonator spectrometer, ACS Nanos 13, 12743 (2019). https://doi.org/10.1021/acsnano.9b04702. [Google Scholar]
- Frigenti G, Cavigli L, Ratto F, Centi S, Murzina TV, Farnesi D, Pelli S, Soria S, Nunzi Conti G, Microbubble resonators for scattering-free absorption spectroscopy of nanoparticles, Opt. Express 29, 31130 (2021). https://doi.org/10.1364/OE.434868. [Google Scholar]
- Frigenti G, Farnesi D, Vesco G, Centi S, Ratto F, Pelli S, Murzina T, Nunzi Conti G, Soria S, Thermometric absorption spectroscopy through active locking of microbubble resonators, Front. Phys. 11, 1226106 (2023). https://doi.org/10.3389/fphy.2023.1226106. [Google Scholar]
All Figures
|
Figure 1 Series of panels showing examples of WGM resonators. Moving from left to right one has (a) a microsphere, (b) a microbubble, (c) a microbottle [26], (d) a microtoroid (adapted with permission from [27] © Optical Society of America). |
| In the text | |
|
Figure 2 Whispering gallery modes in (a) a microsphere made of Erbium doped glass and (b) a microbubble filled with a fluorescent dye. |
| In the text | |
|
Figure 3 Series of panels showing examples of WGMR coupling systems. Moving from left to right one has: (a) a microsphere and an LPG taper, (b)–(c) a microsphere and a standard taper (b: top view, c: front view), (d) a microbubble with an LPG taper and (e) a microbubble with a standard taper. |
| In the text | |
|
Figure 4 (a) Optical picture of a crystalline microdisk, (b) a microcrystalline disk coupled with a lithium niobate waveguide [32], (c) sketch of the prism-microdisk coupling system, (d) picture of the prism-microdisk coupling system implemented in our labs. |
| In the text | |
|
Figure 5 (a) Optical picture of an angle-polished fiber (polishing angle highlighted in blue), (b) picture of a microsphere coupled to an angle polished fiber. |
| In the text | |
|
Figure 6 Sketch of a WGMR characterization setup showing a typical resonance with a Q-factor of about 107 and contrast (or visibility) close to 1. |
| In the text | |
|
Figure 7 (a–b) Pictures of the fabrication setup implementing the flame fabrication technique (a: lateral view, b: top view), (c–d) microspheres with diameters of about 100 μm, (e) overexposed microsphere, (f) underexposed microsphere. |
| In the text | |
|
Figure 8 Optical pictures of the two polymeric microbottles with a diameter of about 240 μm (a) and 490 μm (b). Courtesy from CNR-IREA research group headed by Dr. Romeo Bernini. |
| In the text | |
|
Figure 9 Fabrication steps to produce an active glass microbottle. Reproduced from [26] under Creative Commons License. |
| In the text | |
|
Figure 10 Sketch of MBR fabrication technique: (a) a capillary with a sealed end, (b) microbubble formation by heating, (c) picture of the arc discharge unit in our labs, (d) picture of an MBR after the arch discharge and inflation process. |
| In the text | |
|
Figure 11 Cavity ring down profile of a MBR resonance. |
| In the text | |
|
Figure 12 Panels (a) and (b) Two sketches of the microbubble modeling presented in Section 3. Different colors are used to mark the three dielectric sectors: blue for core, green for walls, red for external medium. Panel (c) shows the orientation of the spherical coordinate system used in this theory with respect to a real microbubble. |
| In the text | |
|
Figure 13 Sketch of the different dielectric zones of the MBR (left) and F(kr) function for the fundamental WGM (right). Colors are used to highlight the sector over which the function extends: blue for the core, green for the walls and red for the external medium. |
| In the text | |
|
Figure 14 Sensing mechanism: (a) mode shifting, (b) mode splitting (Δω is the detuning between the symmetric and asymmetric mode, while γ is the mode linewidth), (c) mode broadening. |
| In the text | |
|
Figure 15 Scattered light measured with a hand-held spectrometer from a batch of microspheres with As204-Dylight800 1:2 ratio (As204-Dylight800 covalently bound to the surface microsphere of a diameter of about 140 μm) for two different pump powers: 148 mW (red squares) and 98 mW (black squares). Inset: Laser spectrum measured with an optical spectrum analyser. |
| In the text | |
|
Figure 16 Cascaded Raman generated in a MBR pumped at 779 nm, showing the first and second order Raman laser lines. |
| In the text | |
|
Figure 17 Sketch of the transmission signal associated with optomechanical vibrations in WGMRs. |
| In the text | |
|
Figure 18 Sketch of a mass sensor based on a microspherical WGMR. When a bovine serum albumina (BSA) molecule binds to the surface of the microsphere, the optical mode shifts, as well as the mechanical frequency of the system. The acoustic mode involved in the detection is a radial breathing mode. From [72]. |
| In the text | |
|
Figure 19 (a) Sketch of the forward SBS generation in a microsphere and the associated acoustic WGM (the acoustic mode is a wineglass mode), (b) optical spectrum of the triply resonant condition. Adapted from [74]. |
| In the text | |
|
Figure 20 (a) Picture of an initial setup used to verify the PA generation from the the GNR inside the MBR, using a piezoelectric transducer for the detection, (b) Ultrasound signal detected through an all-optical reading of the PA wave, using an advanced all-optical setup [19]. |
| In the text | |
|
Figure 21 Top row: schematic representation of a WGM biosensor, resulting from the union of a WGM resonator and a sensing layer. Middle row: main ligands or receptors (antibodies, streptavidin, aptamers, enzymes). Bottom row: main analytes (antigens, biotin(ylated) proteins, aminoacids). Reproduced from [88]. |
| In the text | |
|
Figure 22 WGM resonance recorded at different steps of the functionalisation process: (a) before the process started, (b) after silanization and (c) after an antibody is covalently bound. |
| In the text | |
|
Figure 23 (a) Sensorgram of thrombin binding to a WGMR immobilized with TBA-15 in 1:10 unfiltered human serum (one thrombin addition). (b) Sensorgram of thrombin binding to a regenerated WGMR immobilized with TBA-15 (three additions, 5 μL of 0.3 mg/mL thrombin each). Adapted from [91]. |
| In the text | |
|
Figure 24 Fluorescence images of two MBRs fabricated on the same capillary. (a) Immobilization of goat anti-rabbit IgG labeled with AlexaFluor647 bound on the inner surface of the MBR on the right side. (b) Goat anti-rabbit IgG labeled with AlexaFluor488 bound on the inner surface of the MBR on the left side. (c) Merging of the previous images. Reproduced with permission from [99]. |
| In the text | |
|
Figure 25 The resonance shift curve (black) shows pulses when single Tg proteins adsorb to the gold nanoshell coating the WGMR equator. Blue curve shows the background without the protein nor the gold nanoshell. Insets: optical image of the hybrid WGMR (top left) and resonance profile (bottom right). Adapted from [102]. |
| In the text | |
|
Figure 26 (a) Optoplasmonic single-molecule sensor scheme, experimental setup, and resonance profiles with shifts due to the TOP effect. (b) extinction spectrum of the GNR used in the experiments; (c) Examples of measured resonance wavelength under the attachment of 3-phosphoglycerate kinase (3PGK) molecules. Red and blue shifts are recorded for low and high intensities inside the WGM, respectively. Reproduced from [104]. |
| In the text | |
|
Figure 27 (a) Sketch of the microbottle, (b) Sketch of the GNR adsorbed into the inner surface of the microbottle, (c) Wavelength shift of the wall mode (black), the interface mode (orange) and the core mode (brown). Adapted from [107]. |
| In the text | |
|
Figure 28 Frequency shift of a WGM versus internal pressure for a microbubble having a wall thickness of 3.7 μm. |
| In the text | |
|
Figure 29 (a) Sketch of an SR-OFRR sensor. OFRR 1 is the reference resonator, while OFRR 2 is the sensing one. (b) Theoretical mode splitting for the coupled microbubble against resonance detuning. The red and black squares represent the left and right branches of the modes, respectively. Reprinted with permission from [130]. © 2013 American Chemical Society. |
| In the text | |
|
Figure 30 Sketch resuming the FRET sensing mechanism of a self-propelled microlaser. PLL: poly L-lysine, NR: Nile Red. Reprinted (adapted) with permission from [132]. © 2023 American Chemical Society. |
| In the text | |
|
Figure 31 (a) Sketch of the microsphere with a flake of graphene placed at 30° angle from the equatorial plane. The hybrid WGMR is pumped by an external cavity diode laser (ECDL) that excites soliton combs, which belong to distinct mode families. Adapted from [146]. (b) Sketch of the Brillouin lasing device used for gas detection. BLs: Brillouin laser, PL: pump laser, Gr: Graphene. Adapted from [15]. |
| In the text | |
|
Figure 32 (a) Schematic illustration of the mechanical modes of the cantilever-microsphere structure, the tapered fiber injecting a temporally-modulated laser beam into the WGM, and an acoustic source. (b) Oscillation spectrum of different mechanical modes from the tapered fiber “string”: each mode has been verified by FEM. (c) Demonstration of the dual channel communications. Each row represents a combination of waves acting on the system (the magenta color represents the generating frequency). OM: optical modulation. AM: acoustic modulation. From [74]. |
| In the text | |
|
Figure 33 Top panel: sketch of the optical microcavity ultrasound probe and detection scheme. Bottom panel: PA image of a zebrafish. Adapted from [147]. |
| In the text | |
|
Figure 34 A series of WGMR-based magnetometers. (a) microtoroid with a microsized magnet encapsulated using poly(dimethylsiloxane), (b) microtoroid with an embedded Terfenol-D cylinder, (c) microtoroid with a thin film of Terfenol-D sputter coated on top, (d) a mm-size CaF2 microdisk resonator with a cylinder of Terfenol-D embedded inside. Adapted from [71]. |
| In the text | |
|
Figure 35 Left: sketch of the experimental setup used to demonstrate PA detection through a microbubble resonator. Right: PA response against excitation fluence measured through the MBR transducer for a GNRs colloidal solution. |
| In the text | |
|
Figure 36 (a) Sketch of the experimental setup. MR: mirror, AL: aspherical lens, PD: photodiode, Pol.Con.: polarisation controller. (b) Power-normalized optical shifts for an aqueous solution containing GNRs (1.5 mM Au) and milk powder (1% w/w) (dots). The crosses refer to a solution with only the milk powder. (c) Same shift profiles normalized to their 740 nm values, together with a reference profile from a spectrophotometer (cyan curve). |
| In the text | |
Current usage metrics show cumulative count of Article Views (full-text article views including HTML views, PDF and ePub downloads, according to the available data) and Abstracts Views on Vision4Press platform.
Data correspond to usage on the plateform after 2015. The current usage metrics is available 48-96 hours after online publication and is updated daily on week days.
Initial download of the metrics may take a while.