Figure 12
Download original image
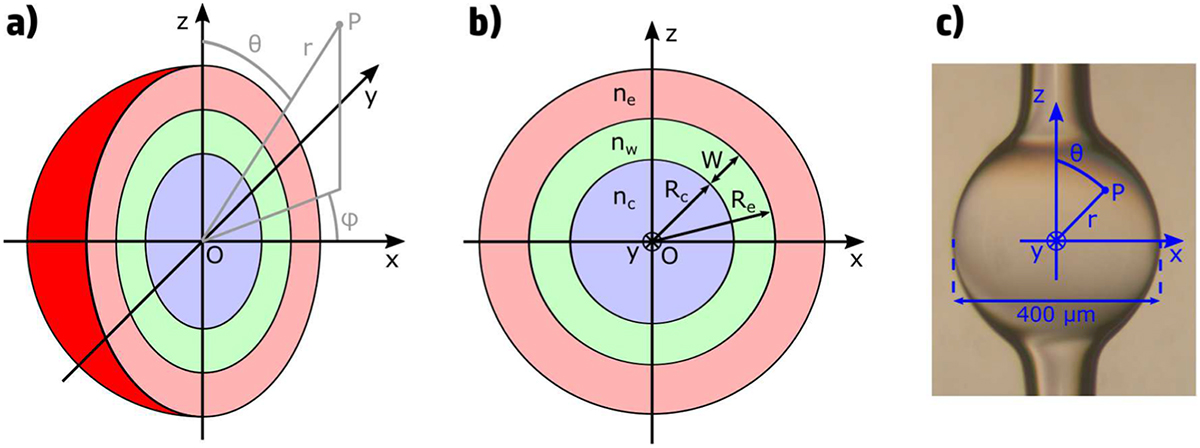
Panels (a) and (b) Two sketches of the microbubble modeling presented in Section 3. Different colors are used to mark the three dielectric sectors: blue for core, green for walls, red for external medium. Panel (c) shows the orientation of the spherical coordinate system used in this theory with respect to a real microbubble.
Current usage metrics show cumulative count of Article Views (full-text article views including HTML views, PDF and ePub downloads, according to the available data) and Abstracts Views on Vision4Press platform.
Data correspond to usage on the plateform after 2015. The current usage metrics is available 48-96 hours after online publication and is updated daily on week days.
Initial download of the metrics may take a while.