Open Access
Review
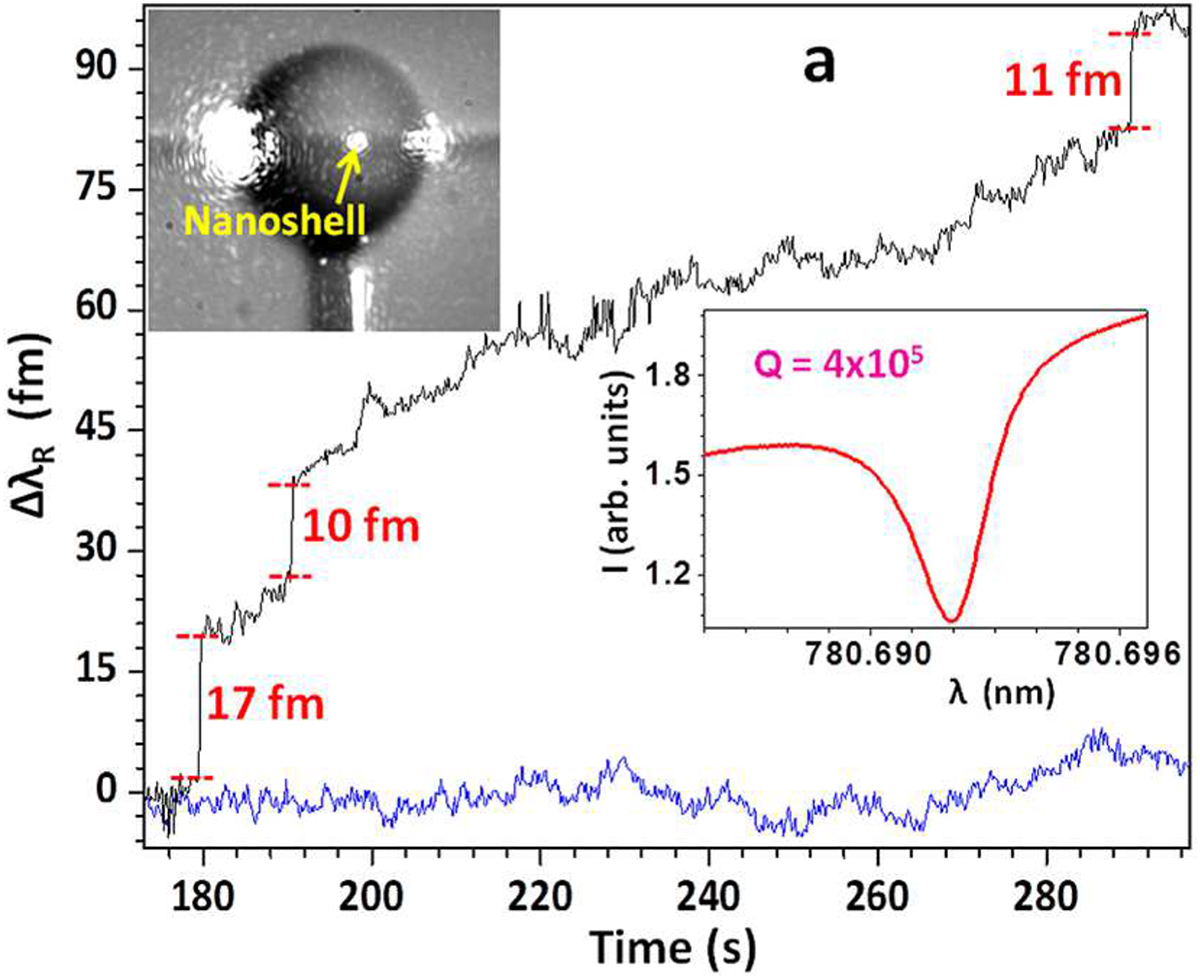
Figure 25
Download original image
The resonance shift curve (black) shows pulses when single Tg proteins adsorb to the gold nanoshell coating the WGMR equator. Blue curve shows the background without the protein nor the gold nanoshell. Insets: optical image of the hybrid WGMR (top left) and resonance profile (bottom right). Adapted from [102].
Current usage metrics show cumulative count of Article Views (full-text article views including HTML views, PDF and ePub downloads, according to the available data) and Abstracts Views on Vision4Press platform.
Data correspond to usage on the plateform after 2015. The current usage metrics is available 48-96 hours after online publication and is updated daily on week days.
Initial download of the metrics may take a while.