Figure 26
Download original image
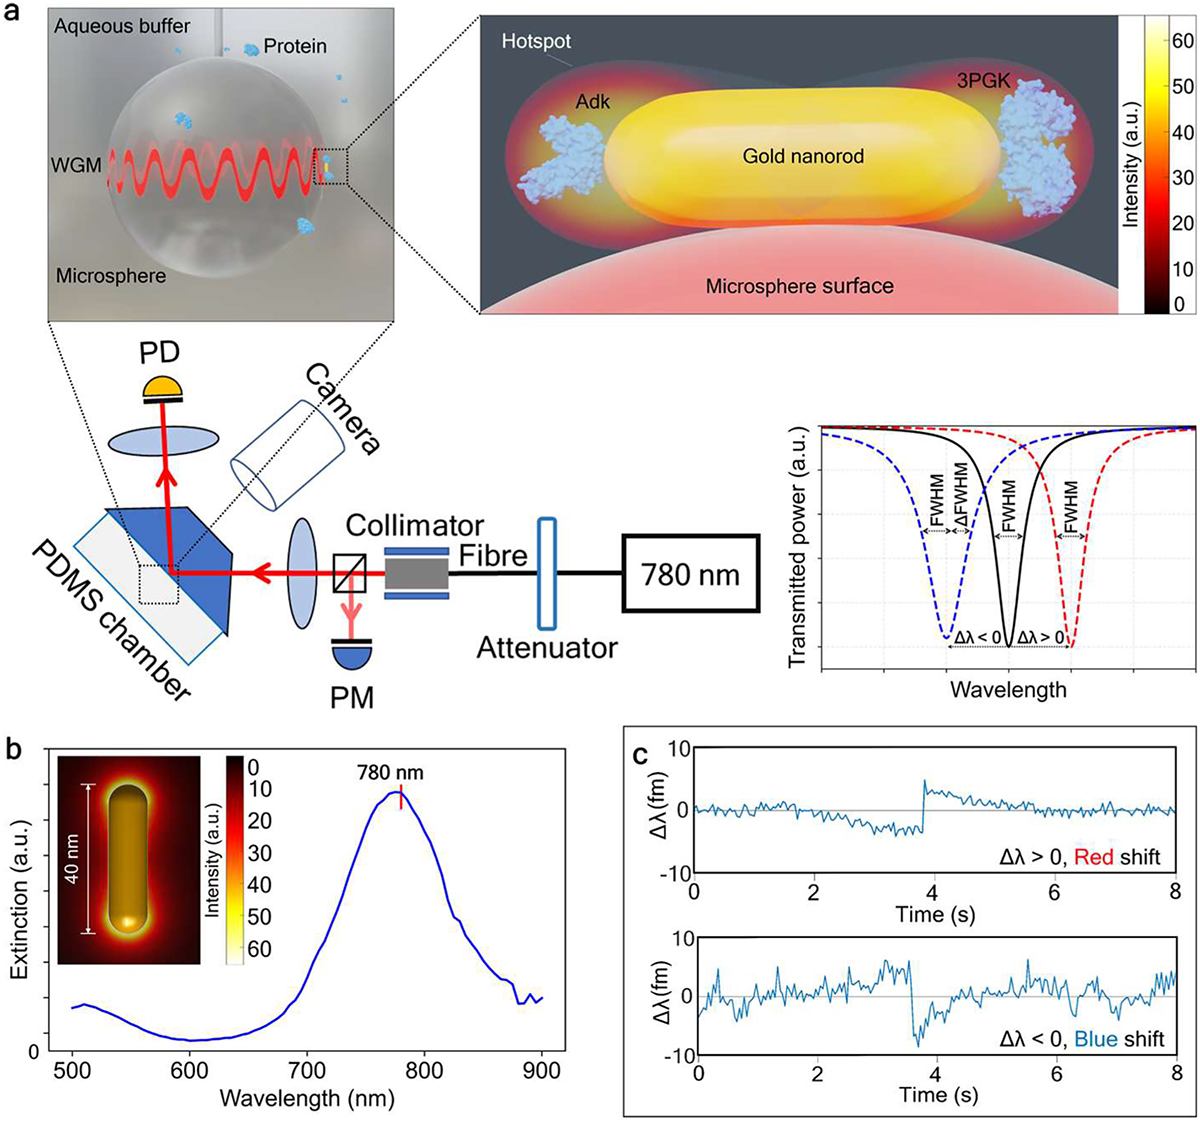
(a) Optoplasmonic single-molecule sensor scheme, experimental setup, and resonance profiles with shifts due to the TOP effect. (b) extinction spectrum of the GNR used in the experiments; (c) Examples of measured resonance wavelength under the attachment of 3-phosphoglycerate kinase (3PGK) molecules. Red and blue shifts are recorded for low and high intensities inside the WGM, respectively. Reproduced from [104].
Current usage metrics show cumulative count of Article Views (full-text article views including HTML views, PDF and ePub downloads, according to the available data) and Abstracts Views on Vision4Press platform.
Data correspond to usage on the plateform after 2015. The current usage metrics is available 48-96 hours after online publication and is updated daily on week days.
Initial download of the metrics may take a while.