Open Access
Review
Figure 35
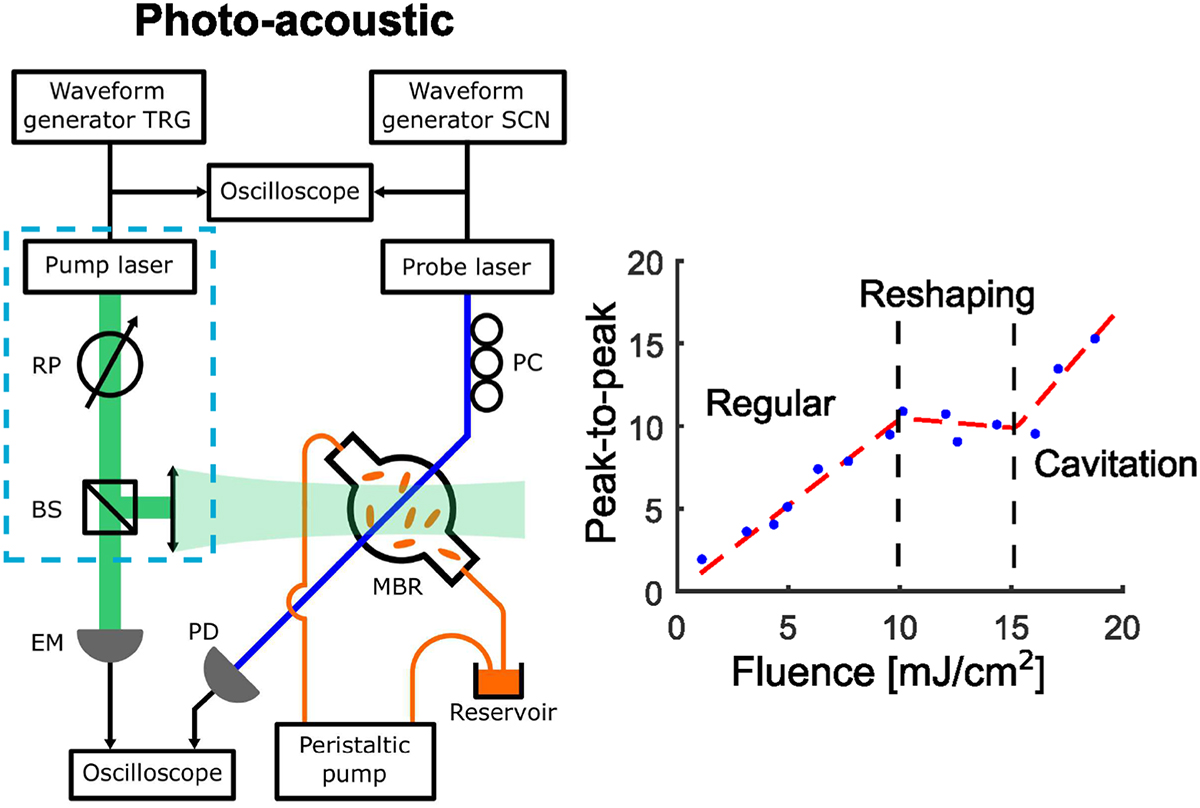
Download original image
Left: sketch of the experimental setup used to demonstrate PA detection through a microbubble resonator. Right: PA response against excitation fluence measured through the MBR transducer for a GNRs colloidal solution.
Current usage metrics show cumulative count of Article Views (full-text article views including HTML views, PDF and ePub downloads, according to the available data) and Abstracts Views on Vision4Press platform.
Data correspond to usage on the plateform after 2015. The current usage metrics is available 48-96 hours after online publication and is updated daily on week days.
Initial download of the metrics may take a while.