Open Access
Review
Figure 20
Download original image
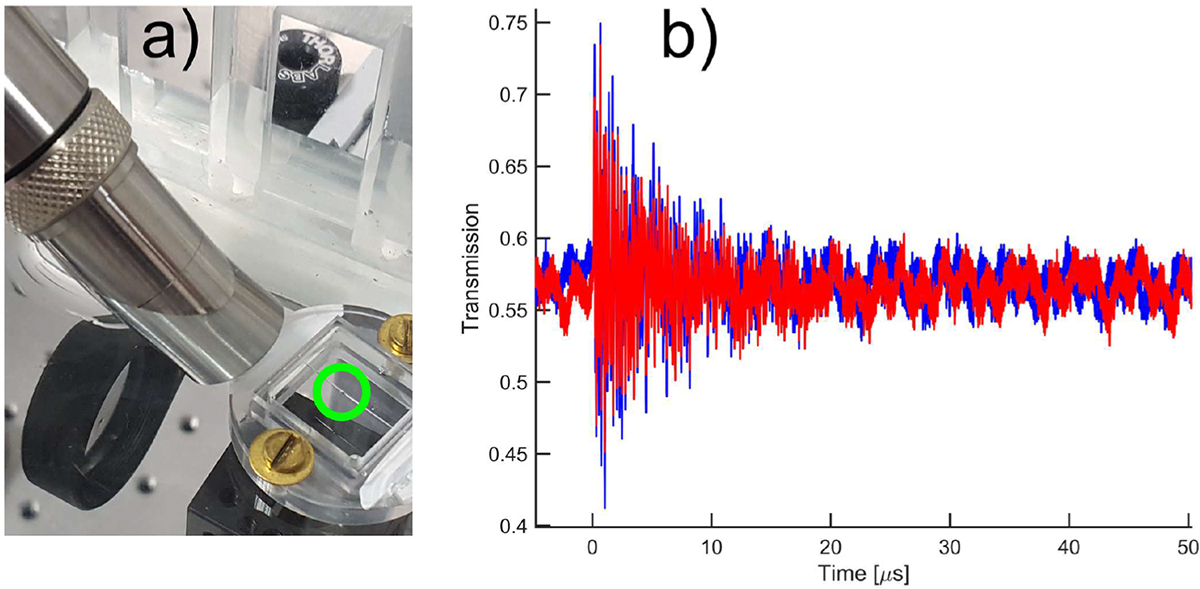
(a) Picture of an initial setup used to verify the PA generation from the the GNR inside the MBR, using a piezoelectric transducer for the detection, (b) Ultrasound signal detected through an all-optical reading of the PA wave, using an advanced all-optical setup [19].
Current usage metrics show cumulative count of Article Views (full-text article views including HTML views, PDF and ePub downloads, according to the available data) and Abstracts Views on Vision4Press platform.
Data correspond to usage on the plateform after 2015. The current usage metrics is available 48-96 hours after online publication and is updated daily on week days.
Initial download of the metrics may take a while.