| Issue |
J. Eur. Opt. Society-Rapid Publ.
Volume 22, Number 1, 2026
|
|
|---|---|---|
| Article Number | 20 | |
| Number of page(s) | 12 | |
| DOI | https://doi.org/10.1051/jeos/2026018 | |
| Published online | 03 April 2026 | |
Research Article
Negative-refractive-index behavior in a periodic photonic metamaterial: unit-cell topology tailoring for broadband response
1
Department of Physics, Faculty of Sciences, Gazi University, Ankara, Türkiye
2
Department of Physics, Graduate School of Natural and Applied Sciences, Gazi University, Ankara, Türkiye
* Corresponding author. This email address is being protected from spambots. You need JavaScript enabled to view it.
Received:
21
January
2026
Accepted:
24
February
2026
Abstract
This paper examines how systematic control of unit-cell topology governs dispersion characteristics and bandwidth stability in configured periodic structures with numerical simulations. Distinct from the existing literature, the study targets a negative refractive index over a broad frequency range, while neural network–based optimization is used as a supporting tool to efficiently guide for bandwidth maximization. Comprehensive analysis is employed to optimize bandwidth effectively and validate the applicability of the resulting low-dispersion periodic structures. For the optimized unit cell, the third photonic band spans a wavelength range 1388–1631 nm (after model enhancement 1429–1578 nm) covering the S, C, and L optical communication bands, demonstrating broadband and stable dispersive behavior beyond a narrow resonance regime. The obtained results are thus expected to enhance the performance of negative-index based photonic components used in optical and photonic communication systems, compact antenna architectures, and advanced material engineering.
Key words: Metamaterials / Photonic crystals / Negative refractive index / Neural network / Machine learning
© The Author(s), published by EDP Sciences, 2026
 This is an Open Access article distributed under the terms of the Creative Commons Attribution License (https://creativecommons.org/licenses/by/4.0), which permits unrestricted use, distribution, and reproduction in any medium, provided the original work is properly cited.
1 Introduction
The literature indicates that artificial intelligence has increasingly been applied to photonic design over the past decades [1–6]; however, an approach that optimizes the operational bandwidth of the negative refractive index has not yet been established. In conventional studies, metamaterials have typically been investigated at a single frequency, namely the resonance point. Pendry demonstrated the super-resolution potential of a negative refractive index at the resonance frequency [7], while Shelby and co-workers reported the first experimental verification of this behavior [8]. In the years that followed, various application-oriented designs have been presented in the literature [9–12]. Artificial neural networks (ANNs) constitute an effective tool for meeting the requirement of guiding light within specific frequency ranges in photonic crystals. In this study, networks trained on diverse material properties are employed to rapidly and accurately predict the effective refractive index and related parameters, thereby enabling calculations that would otherwise require weeks using conventional methods to be completed within a significantly shorter time frame.
The metamaterials considered in this study have gained a prominent position in the field of photonics since the early 2000s and have exhibited extraordinary phenomena such as invisibility, super-resolution, and advanced focusing, enabled by electromagnetic properties not found in nature [13–15]. These structures, formed by periodic arrangements of meta-atoms at the micro- or macro-scale, can control their interaction with electromagnetic waves through geometric tuning. As no natural material possesses such characteristics, the first experimental demonstration of metamaterials was realized in 2000 by Smith and co-workers using periodic arrays of split-ring resonators and metallic subwavelength structures, following approximately four decades of theoretical development [5]. Subsequent variations of this approach [16–18] have established metamaterial design as a broad and active research area.
The concept of a negative refractive index was first introduced by Veselago in 1967 [19]. Materials exhibiting a negative refractive index underpin a wide range of applications, including superlenses, optical camouflage (cloaking) devices, advanced filters, and compact antennas [20–25]. Nevertheless, existing studies have predominantly focused on narrow frequency ranges, largely based on metallic materials. In contrast, broadband metamaterials offer a significantly wider range of applications compared to single-frequency designs, providing substantial advantages in areas such as multi-wavelength imaging, adaptive optics, broadband antennas, and telecommunication systems [26–29]. Moreover, they deliver more stable performance in applications involving variable operating frequencies, including radar stealth and medical imaging.
Over the past few decades, inverse design techniques and topology optimization have become increasingly prominent in the field of photonics [30–40]. Compared with alternative optimization approaches [41–43], topological optimization enables superior performance within restricted device dimensions by analyzing relatively large input parameter window. Surpassing the performance of the conventional design, enhanced digital configuration capabilities improve achievements on photonic device performance [44].
Regression and gradient-based methodology has begun to be utilized as the basis for topology optimization in a wide range of metamaterial applications [45–51]. As for the topic of electromagnetic metamaterials, S. Nanda et al. use an inverse artificial neural network on split ring resonator structural and target parameter dataset [47]. Another inverse design focused on spectral prediction of multi-layered graphene based photonic metamaterials [48]. E. Harper et al. [49] presented a research on all-dielectric meta-surface. In this regard, meta-atom geometry engineering by dielectric materials show that they play a fundamental role on broadband metamaterial based devices. Nevertheless, no data-driven model has been studied to broaden the negative index spectrum of photonic crystals.
This study presents an original artificial-intelligence-assisted methodology for the design of broadband negative-refractive-index photonic media, encompassing both design and computational modeling processes. Optimization techniques aimed at driving the effective refractive index and group velocity into the negative regime are supported by deep neural networks (DNNs) [52], building upon artificial neural network frameworks. The numerical analysis is conducted using a block-iterative frequency-domain method based on the plane-wave approximation. Furthermore, as conventional photonic design workflows are inherently complex, iterative, and time-consuming, machine learning is employed to significantly reduce the trial-and-error process involved in material selection and photonic crystal geometry determination. The proposed approach is expected to facilitate the discovery of strong negative-refractive-index behaviors that are difficult to achieve using classical methods, thereby not only accelerating the design process but also enabling more realistic implementations of broadband superlenses and other advanced optical devices.
2 Methods of calculation
A variety of well-established analytical and computational design methods based on electromagnetic theory are available for the analysis and design of photonic media, allowing researchers to easily construct geometries and perform calculations on structures with complex configurations. Among the most widely used tools are MIT Photonic Bands (MPB) and MIT Electromagnetic Equation Propagation (MEEP), which have proven reliability in photonic simulations [53, 54]. The design approaches employed in this context can generally be categorized as combinations of basic and advanced electromagnetic theory, finite-difference time-domain (FDTD) simulations, frequency-domain simulations, topological design strategies, optimization methods, and hybrid frameworks integrating these techniques [55, 56].
Phenomena such as wave propagation in space, the calculation of transmission and reflection coefficients, and the analysis of wavefronts and field patterns can be accurately evaluated using time-domain simulations. FDTD-based simulation tools, which are widely available in the literature [57], are particularly suited for this purpose. These tools are commonly used to solve electromagnetic problems associated with periodic structures such as photonic crystals. By solving Maxwell’s equations under periodic boundary conditions, photonic band structures can be obtained. This enables the determination of group and phase velocities, photonic band gaps, light–matter interactions, and other key optical, photonic, and electromagnetic properties in periodic media.
Metamaterials can be analyzed using frequency-domain simulations, focusing on their unit-cell properties, as well as time-domain simulations that capture their dynamical behavior. While metamaterial designs typically rely on metallic unit cells with inherently resonant frequency responses, it will be shown in the following sections that broadband unit cells can exhibit similar characteristic behavior.
In this context, machine learning tools will be developed and employed to maximize the operational bandwidth within the project. Using MATLAB [58] together with its deep learning and artificial neural network modules, the relevant algorithms will be trained on datasets containing material properties to achieve a negative refractive index over a broad bandwidth by designing the size, arrangement, and geometric structure of meta-atoms in photonic crystals. This approach enables accurate prediction of refractive index values and other key parameters without the need for extensive preliminary testing. The process is planned to proceed through the following steps:
2.1 Target definition and data collection
The primary objective of the study is defined as achieving a negative refractive index over a wide bandgap. Large datasets incorporating meta-atoms with varying sizes, arrangements, and geometrical configurations will be generated. At this stage, simulation tools such as MEEP and MPB will be used to compute the relevant optical properties in line with the optimization goal.
2.2 Identification of input and output features
Geometrical parameters, including size, arrangement, and structural features, will be defined as input variables, while the targeted optical properties and performance metrics will serve as outputs. To improve model learning, data scaling (ensuring that all features lie within a specific range) and normalization (rescaling data to a common distribution or magnitude) will be applied.
2.3 Construction of the artificial neural network model
For the multi-parameter calculations involved, a deep neural network (DNN) model will be implemented in MATLAB using the Deep Learning Toolbox [52]. The presence of hidden layers in addition to the input and output layers qualifies the model as a deep learning framework. Neurons within the hidden layers interact to process input data from multiple perspectives, enabling the generation of diverse and complex output responses.
2.4 Model training
The workflow will include separate training, validation, and test stages. Initially, the model will be trained using the train Network function. Subsequently, error metrics will be evaluated, and multi-parameter optimization will be performed if required.
2.5 Optimization procedure
The trained model will be tasked with predicting the meta-atom parameters, geometries, dimensions, and spatial arrangements required to achieve the specified target. Simulations will then be repeated using the predicted parameters to validate the results, and the model will be retrained using the newly generated data.
2.6 Design and analysis of results
The simulation outcomes of the designed structures will be analyzed through graphical representations and physical interpretation, and their consistency with the defined objectives will be assessed.
3 Results and discussion
This study focuses on achieving a selected photonic band in a dispersion less manner through artificial intelligence–assisted design. A direct indicator of a negative refractive index is the group velocity, given by:  . To accommodate a larger number of design configurations, a binary geometry, as illustrated in Figure 1, is considered.
 |
Figure 1 Each unit cell is defined by a randomly generated 8 × 8 square grid, where the black regions represent dielectric material with relative permittivity ε r = 9, and the white regions correspond to vacuum with ε r = 1. |
Such a structure comprises 264 distinct design possibilities. The relative dielectric permittivity of the material is chosen as  . Following the execution of frequency-domain simulation tools for 10 000 randomly generated unit-cell geometries, a dataset is constructed. This dataset consists of 10 000 input samples, each containing 64 binary indicators representing the presence or absence of material, and output parameters including the effective refractive index (n
eff) and the bandwidth defined by (ω
max − ω
min). As the predictive model, fitrgp command is employed. The resulting model yields a coefficient of determination of R
2 = 0.75 for both output parameters.
. Following the execution of frequency-domain simulation tools for 10 000 randomly generated unit-cell geometries, a dataset is constructed. This dataset consists of 10 000 input samples, each containing 64 binary indicators representing the presence or absence of material, and output parameters including the effective refractive index (n
eff) and the bandwidth defined by (ω
max − ω
min). As the predictive model, fitrgp command is employed. The resulting model yields a coefficient of determination of R
2 = 0.75 for both output parameters.
Considering Figure 2, although the group velocity model generally produces accurate predictions, the narrow range of the output values causes the R 2 scores to deviate significantly from unity. While the prediction–ground truth plot captures the overall trend – particularly at low absolute group velocities – the linear dependence of the residuals on the predicted values constitutes a notable limitation of the model. The right-skewed distribution observed in the residual histogram confirms a tendency toward underestimation, whereas the pronounced deviations revealed by the ratio comparison indicate that a simple noise interpretation is insufficient. These observations suggest that the model remains open to further improvement. In Figure 3 as the second output parameter, namely the bandwidth, the calculations are based on the spectral region within ±10% deviation from the center of the spectrum exhibiting a negative effective refractive index. Although the model successfully learns the overall trend, all predictions systematically fall below the true values. The clearly visible linear increase in the residual–prediction plot indicates that the model errors are not random but instead depend on the predicted values, implying that the underlying true relationship is inherently nonlinear. Furthermore, the asymmetry in the residual histogram and the step-like pattern observed in the ratio comparison demonstrate that the errors are not normally distributed and that the model does not adequately capture the noise characteristics. Consequently, while the model is capable of capturing the trend, particularly for narrower bandwidths, it exhibits limitations in representing the nonlinear relationship. This model is therefore also open to further refinement, although it provides a reasonable level of adequacy for predicting the outputs considered within the scope of this study.
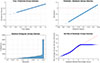 |
Figure 2 The input and output values used for group velocity predictions, along with the resulting prediction–actual, residual–prediction, frequency–residual, and residual ratio comparison plots. |
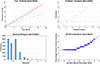 |
Figure 3 The input and output values used for bandwidth predictions, along with the resulting prediction–actual, residual–prediction, frequency–residual, and residual ratio comparison plots. |
The model is tasked with identifying a geometry that yields an effective refractive index of  and a bandwidth ratio of
![Mathematical equation: $$ \Delta f=\frac{{\omega }_{\mathrm{max}}-{\omega }_{\mathrm{min}}}{\left[\frac{\left({\omega }_{\mathrm{max}}+{\omega }_{\mathrm{min}}\right)}{2}\right]}=0.15, $$](/articles/jeos/full_html/2026/01/jeos20260008/jeos20260008-eq4.gif) (1)while exhibiting a dispersion diagram that is maximally isolated from the second and fourth bands within this frequency interval. The geometry proposed by the model, along with the corresponding dispersion diagram, is presented in Figure 4.
(1)while exhibiting a dispersion diagram that is maximally isolated from the second and fourth bands within this frequency interval. The geometry proposed by the model, along with the corresponding dispersion diagram, is presented in Figure 4.
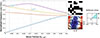 |
Figure 4 For the optimized result, the normalized frequencies obtained from the Bloch wave solutions are plotted as a function of the wave vector. For the best-performing geometry, the mode profile of the third band corresponding to the normalized frequency ωa⁄2πc = 0.55 is illustrated. |
The geometry proposed by the model is tested using the MPB program, and the effective refractive index is calculated as  ). The minimum and maximum normalized frequency values are found to be 0.480 and 0.564, respectively. Based on these simulation results, the center frequency is defined as (
 ), and the corresponding bandwidth ∆f = 0.161 is then obtained. Herein, the MEEP and MPB simulation frameworks employ dimensionless units, the target index-related parameters correspond to real-world wavelengths expressed in nanometers in the present study. If target wavelength is
 ![Mathematical equation: $ {\left[{\lambda }_{\mathrm{cen}}\right]}_{\mathrm{target}}=1500\enspace \mathrm{nm}$](/articles/jeos/full_html/2026/01/jeos20260008/jeos20260008-eq7.gif)
![Mathematical equation: $$ {\left[{\lambda }_{\mathrm{min}(\mathrm{max})}\right]}_{\mathrm{target}}={\left[{\lambda }_{\mathrm{min}(\mathrm{max})}\right]}_{\mathrm{simulation}}\frac{{\left[{\lambda }_{\mathrm{cen}}\right]}_{\mathrm{target}}}{{\left[{\lambda }_{\mathrm{cen}}\right]}_{\mathrm{simulation}}}. $$](/articles/jeos/full_html/2026/01/jeos20260008/jeos20260008-eq8.gif) (2)
(2)
The wavelength range of 1388–1631 nm obtained using this relation covers the region encompassing the S, C, and L bands (1400–1600 nm). This result demonstrates that the final performance criterion of achieving a low–refractive-index electromagnetic medium over the optical communication bandwidth has been successfully satisfied.
An electromagnetic wave is incident at an angle of 45° onto a structure formed by arranging the geometry shown in Figure 5 in a square lattice (number of layers: 10) at a normalized frequency of ωa/2πc = 0.55. According to Snell’s law, unlike the case of a positive-refractive-index medium, the refracted wave is expected to transition from Region III to Region I when passing from one medium to another; however, it is clearly observed to propagate within Region II.
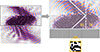 |
Figure 5 The steady-state electromagnetic wave distribution in the periodic square lattice pattern of the optimized unit cell. |
The reason for this behavior is explained by the relation: (3)
(3)
which indicates that, depending on the sign of the refractive index of Medium 1, sgn(n 1 ), the sign of the angle formed between the wave in Medium 2 and the surface normal is reversed. Consequently, the attainment of a negative refractive index is confirmed by the condition sgn(n 1) < 0.
In periodic structures such as all dielectric photonic crystals, the scattering response of each individual meta-atom typically corresponds to a positive effective refractive index. However, the collective behavior emerging from Bloch-wave solutions [53] in the frequency domain, as well as from time-domain simulations of electromagnetic wave propagation (combination of destructive/constructive interferences), can exhibit characteristics consistent with an effective negative refractive index. In other words, the phase velocity and group velocity become oppositely directed. Such behavior is generally expected to arise in higher-order bands, where the dispersion relation significantly deviates from a simple plane-wave character (e.g., third band and above). In the present study, this phenomenon is observed in the third band.
It has been demonstrated that a negative effective refractive index can be achieved through photonic medium design. As a general methodology, models were developed by learning the input parameters using different approaches, the adequacy of these models was evaluated, and inverse design was employed to predict input configurations capable of yielding the desired output parameters. However, as noted in the previous section, certain aspects remain open to further improvement, one of which is the enhancement of the R 2 performance.
For this reason, the investigation of negative refractive index generation was extended in the final part of the study. In this stage, rather than considering a single incidence angle, wave-vector–normalized-frequency solutions corresponding to waves incident at multiple angles (0–45°) were computed using 10 000 randomly generated parameter sets to construct a new dataset. The geometry was kept identical to the binary geometry presented in the previous section, while deep learning models were employed for data processing and analysis.
Using this approach, the R 2 values for both output parameters were increased beyond 0.98 when evaluated on the training dataset. The improvements achieved for both output types are illustrated in Figures 6 and 7.
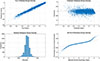 |
Figure 6 The input and output values associated with post-training group velocity predictions obtained using deep learning models, together with the resulting prediction–actual, residual–prediction, frequency–residual, and residual ratio comparison plots. |
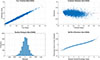 |
Figure 7 The input and output values associated with post-training bandwidth predictions obtained using deep learning models, together with the resulting prediction–actual, residual–prediction, frequency–residual, and residual ratio comparison plots. |
The group velocity model exhibits strong performance when enhanced by deep learning. The predicted versus actual relationship closely follows a linear trend, and no systematic bias is observed. In the residual–prediction plot, the data points are largely distributed around zero. Although the residuals are concentrated within a narrow range, a spread toward extreme values is also observed, which may increase the error margin in predicting group velocities closer to −1.
The residual histogram forms an almost symmetric bell-shaped distribution. The ratio comparison of the residuals follows the reference line over a broad range, with deviations appearing only in the extreme regions. Overall, deep learning demonstrates a balanced and statistically consistent performance in group velocity prediction by accurately scaling a low-variance variable.
The deep learning model developed for bandwidth prediction successfully captures the overall trend, similar to the case of group velocity. In the predicted versus actual plot, the data points lie close to the ideal 45° line, indicating that the model accurately scales the output. In the residual–prediction plot, the residuals are distributed around zero without forming a pronounced pattern, suggesting the absence of systematic error. The residual histogram exhibits an approximately normal distribution with a mean close to zero, providing further evidence of the model’s effectiveness. Aside from minor deviations observed in the ratio comparison, the majority of the residuals closely follow the reference line, indicating statistically consistent performance. Overall, this model produces significantly more balanced, scale-independent, and highly accurate predictions compared to the previous GPR model.
Figures 8 and 9 present the dispersion diagrams of the first four bands for waves incident at two different angles ( and
and  ). While generating these plots, the deep learning model was constrained to yield the following target values in the third band:
  ,
,  . The magnitude of the wave vector (
 ) and the third-band frequency are first considered in order to identify the data point closest to the target frequency. By selecting the immediate neighboring points before and after this point, the changes in angular frequency (
 ) and wave vector (
 ) are computed, yielding an approximate derivative given by: dω/dk. As a result, the approximate values of k and ω at the target point are reported. Using equation (2), the resulting bandwidth Δf for normal incidence (0°) corresponds to the wavelength range of 1429–1578 nm, which encompasses the S, C, and L bands. This outcome further confirms that the final performance criterion – achieving a low-refractive-index electromagnetic medium over the optical communication bandwidth – has been successfully satisfied.
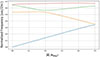 |
Figure 8 The dispersion distribution for an incident wave with an angle of 0° [arctan(0.0)]. |
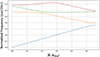 |
Figure 9 The dispersion distribution for an incident wave with an angle of 26.6° [arctan(0.5)]. |
3.1 Fine tuning: robustness and feasibility
In this subsection we give remarks on target material properties and present robustness and feasibility of previous geometries. In this manner, an alternative design with an improved methodology is proposed.
Let us begin with the target relative permittivity (ε
r
= 9) of the previous analyses in which zinc-blende Gallium Phosphide (GaP) emerges as one of the most fabrication-compatible materials. GaP exhibits negligible absorption in the 1400–1600 nm wavelength range at high material purity, while its refractive index remains nearly constant at  [59, 60]. Nanophotonic devices based on GaP have also been successfully fabricated recently using topology-optimization design methodologies [61], further supporting its technological viability. Nevertheless it is challenging to obtain vertically thick (that corresponds to out of plane direction in 2D simulations) blocks and fabricated device may cause out of plane losses and modal deviations due to limited thickness and sidewall tapering. Besides telecommunication band, same relative permittivity coincides with that of Alumina (Al2O3) which shows low loss tangent and no remarkable dispersion within 1–20 GHz [62]. In this case, none of the abovementioned issues will be encountered and negative index refraction is expected to show similar behavior between computations and experimental results.
On the other hand Silicon (Si) corresponds to target  relative permittivity. 1550 nm optical communication wavelength is already the most suitable region where Si almost does not present dispersion such that refractive index varies from 3.46 to 3.44 between 1400 and 1600 nm. It also has extinction coefficient less then
  in the same region. Accordingly, this subsection presents the results obtained for an alternative geometry based on Si as the target material. Dielectric constants were always kept fixed for all optimizations, if the target material is not dispersionless then this condition should be considered in simulations or should be analyzed as post-optimization process. Moreover, if the material has non-negligible extinction coefficient, then total loss due to absorption of a finite-size device should be analyzed in time-domain simulations via transmission efficiency calculations.
Another concern on a realistic design covers manufacturing errors. In topology-optimization-based fabrication processes, one of the most common error sources is under-etching and over-etching [63]. These deviations typically manifest as systematic, unidirectional fabrication errors that depend on the specific etching process, leading to lateral feature growth or shrinkage on the order of ±10 nm.
Additional factors such as material impurities or temperature variations may induce changes in the dielectric constant. However, both GaP and Si is known to be relatively robust against temperature-induced variations. In particular, at 1550 nm the thermo-optic coefficient is quite small, approximately  and
and  for GaP and Si [64, 65], respectively. These results directly indicate weak temperature sensitivity in the telecom band.
Considering all these factors, it is reasonable to expect that in realistic, fabrication-inclusive implementations, performance degradation will not primarily originate from material dispersion or absorption. Instead, it is more likely to stem from impurity-induced variations in the dielectric constant and from geometric deviations introduced during fabrication.
Keeping in mind all the factors above, unlike previous optimization studies, a 4×4 lattice exhibiting repeating symmetry was considered in this work. The geometry is formed by uniformly sized square blocks. A total of 2500 randomly generated until cells were simulated. Dielectric constant of the material was selected as  to ensure compatibility with Si in the telecommunications frequency range. Furthermore, the design process focused on identifying a geometry that mitigates the impact of systematic fabrication-induced deviations, thereby enhancing robustness against manufacturing tolerances. Repeating pattern of the meta-atoms is given as subsets in Figure 10 (Black: Si, White: Vacuum, 1a = 500 nm).
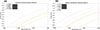 |
Figure 10 (a) Variation of the group index distributions due to under/over-etching in Band 3. (b) Sensitivity of the response to relative permittivity variations ( |

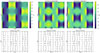 |
Figure 11 Spatial distribution of the real part of the Poynting vector (top row) and the corresponding in-plane Poynting vector field (bottom row) for the optimized 4 × 4 symmetric geometry. The colormap illustrates the magnitude and sign of the power flow, while the arrow plots indicate the local energy propagation direction across the unit cell. The results highlight the symmetry-induced field distribution and energy transport characteristics of the structure. (k Γ-M = 125 × 10−3, band: 1; k Γ-M = 5.00 × 10⁻³, band:3; k Γ-M = 125 × 10−3, band: 3. |
To evaluate the practical feasibility and robustness of the design, we first performed simulations covering systematic fabrication error. The variation in group refractive index induced by under- and over-etching is shown in Figure 10a. Then material parameter sweep over the range  was done, and the results are presented in Figure 10b. Figures show that lateral expansion, namely overgrowth (
 ) causes a similar orientation on index deviation as that of increasing permittivity and vice versa. This can be explained by filling ratio of background and effective medium theories. Final geometry is tolerant to both error types such that even the worst cases have operating bandwidths greater than 60 nm within the target operation band (1500–1600 nm).
In a negative refractive index (NRI) medium, the wave vector
k
, the electric field
E
, and the magnetic field
H
follow a left-handed orientation. Physically, this implies that the direction of phase propagation is opposite to the direction of energy flow. In practice, this behavior can be verified through two main conditions: (i) the dot product between the group velocity and the wave vector must be negative ( ), indicating that energy flows opposite to the phase velocity; and (ii) the Poynting vector (which represents the direction of energy transport) must be in opposite direction with respect to the wave vector. When both conditions are satisfied, the medium does not merely exhibit a backward Bloch mode, but genuinely demonstrates left-handed behavior with an effective negative refractive index.
- (i)
 is satisfied automatically since
  and
and  within operation bandwidth.
 - (ii)
Poynting vector field within a single unitcell should be analyzed as well.
 should also be satisfied for any (w, k) within operation bandwidth. See Sx Poynting distribution and Poynting Vector Field distributions for varying wave vector and diagram bands.
  condition is satisfied under band-3 within
  such that
  while
while  .
.
Extensive studies on broadband negative refractive index (NRI) metamaterials have been reported in the literature [66–71]. Nguyen et al. [66] aimed to achieve broadband negative permittivity by combining fishnet dimer-type geometries with copper layers. For the fishnet dimer configuration, they experimentally demonstrated an operational bandwidth of approximately 10%. In [67], the authors experimentally fabricated a curved fishnet metamaterial integrated into a rolled-up tube (RUT) structure, consisting of eight alternating layers of gold (Au) and silicon dioxide (SiO2). They showed that the negative-index region can be precisely tailored by adjusting the dimensions of the perforated holes defining the metamaterial geometry.
Islam et al. [68] reported a negative real refractive index peak exceeding 3 GHz across the C- to X-band frequency range. In another study [69], thermo-sensitive VO2 films were employed to investigate temperature-tunable split-ring-resonator-based metamaterials operating in the THz regime. For low-loss performance, the ratio of the real part of the refractive index to its imaginary part was adopted as a key figure of merit (FOM). A similar performance criterion was also considered in the THz study presented in [70], where the design was based on asymmetrically aligned paired cut metal wires positioned on the front and back sides of a dielectric substrate. Rasad et al. [71], on the other hand, demonstrated a single-layer periodic circular silver structure fabricated on a PET substrate, achieving a negative refractive index peak value as low as −57 within the 2.00–3.55 GHz frequency range.
In contrast to these previous studies, which primarily aimed at achieving or enhancing negative refractive index behavior without explicitly stabilizing it at a fixed negative value, the present work focuses on maintaining the negative refractive index as constant as possible over an extended bandwidth. Moreover, since most conventional approaches rely on metallic layers, the performance metric is typically defined by the ratio between the negative real part and the imaginary part of the refractive index to ensure low-loss operation. However, the designs considered in this study are based entirely on dielectric materials – such as Si, GaP, and (in the microwave regime) Al2O3 – which exhibit near-zero absorption within their respective operational wavelength ranges. Consequently, the proposed structures inherently satisfy the low-loss criterion at the highest level without requiring additional optimization of the real-to-imaginary index ratio.
4 Conclusions
The numerical results demonstrate that the proposed AI-assisted framework can successfully identify photonic geometries exhibiting a negative effective refractive index over a broad and practically relevant frequency interval. For the optimized unit cell, the third photonic band exhibits a normalized frequency range from 0.480 to 0.564, corresponding to a wavelength interval of approximately 1388–1631 nm (after model enhancement 1429–1578 nm). This range fully covers the S, C, and L optical communication bands, indicating that the designed structure operates well beyond a narrow resonance regime and maintains stable dispersive behavior across a wide bandwidth.
The dispersion analysis further confirms that the targeted band remains well isolated from adjacent bands, ensuring low inter-band coupling and reduced dispersion. Full-field electromagnetic simulations reveal clear backward-wave propagation and negative refraction consistent with the extracted group velocity and effective refractive index values. These observations provide direct physical validation of the numerical predictions and confirm that the negative-index response originates from the engineered photonic dispersion rather than from resonant or metallic effects.
From a design perspective, the results highlight the originality of the proposed approach: instead of tuning geometric parameters through trial and error, the negative refractive index and bandwidth are achieved through inverse design guided by data-driven models. The strong agreement between predicted and simulated results shows that the method reliably captures the nonlinear relationship between geometry and dispersion. This establishes the framework as a practical and scalable tool for the systematic design of broadband negative-index photonic media.
Funding
This research received no external funding.
Conflicts of interest
The authors have nothing to disclose.
Data availability statement
The data supporting the findings of this study are available from the corresponding author upon reasonable request.
Author contribution statement
Conceptualization, C.A. and B.B.O.; Methodology, B.B.O.; Software, C.A., E.H., and B.B.O.; Formal Analysis, B.B.O. and I.O.A.; Investigation, C.A., E.H., B.B.O., and I.O.A.; Writing – Original Draft Preparation, C.A., E.H., B.B.O., and I.O.A.; Writing – Review & Editing, E.H., B.B.O., and I.O.A.; Visualization, B.B.O. and I.O.A.; Supervision, B.B.O. and I.O.A.; Project Administration, C.A. and B.B.O.
Acknowledgments
The authors gratefully acknowledge the support of the Scientific and Technological Research Council of Turkey (TÜBİTAK), Project No. 2209-A/1919B012461048.
References
- Harper ES, Coyle EJ, Vernon JP, Mills MS, Inverse design of broadband highly reflective metasurfaces using neural networks, Phys. Rev. B. 101, 195104 (2020). https://doi.org/10.1103/PhysRevB.101.195104. [Google Scholar]
- Zhao J, Wu X, Cao D, Zhou M, Shen Z, Zhao X, Broadband omnidirectional visible spectral metamaterials, Photonics Res. 11, 1284–1293 (2023). https://doi.org/10.1364/PRJ.482542. [Google Scholar]
- Pendry JB, A chiral route to negative refraction, Science 306, 1353–1355 (2004). https://doi.org/10.1126/science.1104467. [NASA ADS] [CrossRef] [Google Scholar]
- Li Z, Zhao R, Koschny T, Kafesaki M, Alici KB, Colak E, Soukoulis CM, Chiral metamaterials with negative refractive index based on four “U” split ring resonators, Appl. Phys. Lett. 97, 081901 (2010). https://doi.org/10.1063/1.3457448. [Google Scholar]
- Smith DR, Padilla WJ, Vier DC, Nemat-Nasser SC, Schultz S, Composite medium with simultaneously negative permeability and permittivity, Phys. Rev. Lett. 84, 4184–4187 (2000). https://doi.org/10.1103/PhysRevLett.84.4184. [CrossRef] [Google Scholar]
- Pendry JB, Schurig D, Smith DR, Controlling electromagnetic fields, Science 312, 1780–1782 (2006). https://doi.org/10.1126/science.1125907. [CrossRef] [MathSciNet] [PubMed] [Google Scholar]
- Pendry JB, Negative refraction makes a perfect lens, Phys. Rev. Lett. 85, 3966–3969 (2000). https://doi.org/10.1103/PhysRevLett.85.3966. [CrossRef] [Google Scholar]
- Shelby RA, Smith DR, Schultz S, Experimental verification of a negative index of refraction, Science 292, 77–79 (2001). https://doi.org/10.1126/science.1058847. [CrossRef] [Google Scholar]
- Pallavi M, Kumar P, Ali T, Shenoy SB, Modeling of a negative refractive index metamaterial unit-cell and array for aircraft surveillance applications, IEEE Access 10, 99790–99812 (2022). https://doi.org/10.1109/ACCESS.2022.3206358. [Google Scholar]
- Aziz RS, Koziel S, Pietrenko-Dabrowska A, Millimeter wave negative refractive index metamaterial antenna array, Sci. Rep. 14, 16037 (2024). https://doi.org/10.1038/s41598-024-67234-z. [Google Scholar]
- Wang J, Allein F, Boechler N, Friend J, Vazquez-Mena O, Design and fabrication of negative-refractive-index metamaterial unit cells for near-megahertz enhanced acoustic transmission in biomedical ultrasound applications, Phys. Rev. Appl. 15, 024025 (2021). https://doi.org/10.1103/PhysRevApplied.15.024025. [Google Scholar]
- Datta S, Mukherjee S, Shi X, Haq M, Deng Y, Udpa L, Rothwell E, Negative index metamaterial lens for subwavelength microwave detection, Sensors 21, 4782 (2021). https://doi.org/10.3390/s21144782. [Google Scholar]
- Padilla WJ, Basov DN, Smith DR, Negative refractive index metamaterials, Mater. Today 9, 28–35 (2006). https://doi.org/10.1016/S1369-7021(06)71573-5. [Google Scholar]
- Lee SH, Park CM, Seo YM, Kim CK, Reversed Doppler effect in double negative metamaterials, Phys. Rev. B 81, 241102 (2010). https://doi.org/10.1103/PhysRevB.81.241102. [Google Scholar]
- Zhu R, Liu XN, Huang GL, Study of anomalous wave propagation and reflection in semi-infinite elastic metamaterials, Wave Motion 55, 73–83 (2015). https://doi.org/10.1016/j.wavemoti.2014.12.007. [Google Scholar]
- Chen HT, Taylor AJ, Yu N, A review of metasurfaces: physics and applications, Rep. Prog. Phys. 79, 076401 (2016). https://doi.org/10.1088/0034-4885/79/7/076401. [Google Scholar]
- Kumar R, Kumar M, Chohan JS, Kumar S, Overview on metamaterial: history, types and applications, Mater. Today Proc. 56, 3016–3024 (2022). https://doi.org/10.1016/j.matpr.2021.11.423. [Google Scholar]
- Capolino F, Applications of metamaterials, CRC Press, Boca Raton (2017). [Google Scholar]
- Veselago VG, The electrodynamics of substances with simultaneously negative values of ε and μ, Sov. Phys. Usp. 10, 509–514 (1968). https://doi.org/10.1070/PU1968v010n04ABEH003699. [CrossRef] [Google Scholar]
- Li J, Zeng Q, Liu R, Denidni TA, Beam-tilting antenna with negative refractive index metamaterial loading, IEEE Antennas Wirel. Propag. Lett. 16, 2030–2033 (2017). https://doi.org/10.1109/LAWP.2017.2694400. [Google Scholar]
- Xu HX, Wang GM, Qi MQ, Lv YY, Gao X, Metamaterial lens made of fully printed resonant-type negative-refractive-index transmission lines, Appl. Phys. Lett. 102, 193502 (2013). https://doi.org/10.1063/1.4804602. [Google Scholar]
- Haxha S, AbdelMalek F, Ouerghi F, Charlton MDB, Aggoun A, Fang XJSR, Metamaterial superlenses operating at visible wavelength for imaging applications, Sci. Rep. 8, 16119 (2018). https://doi.org/10.1038/s41598-018-33572-y. [Google Scholar]
- Islam MM, Islam MT, Samsuzzaman M, Faruque MRI, Compact metamaterial antenna for UWB applications, Electron. Lett. 51, 1222–1224 (2015). https://doi.org/10.1049/el.2015.2131. [Google Scholar]
- Choudhury B, Jha RM, A review of metamaterial invisibility cloaks, Comput. Mater. Contin. 33, 275–303 (2013). [Google Scholar]
- Krzysztofik WJ, Cao TN: Metamaterials in application to improve antenna parameters, Metamaterials Metasurf. 12, 63–85 (2018). [Google Scholar]
- Antoniades MA, Zhu J, Selvanayagam M, Eleftheriades GV Compact, wideband and multiband antennas based on metamaterial concepts, in Proc. 4th Eur. Conf. Antennas Propag. (IEEE, 2010), pp. 1–5. [Google Scholar]
- Saeidi T, Ismail I, Wen WP, Alhawari AR, Mohammadi A, Ultra-wideband antennas for wireless communication applications, Int. J. Antennas Propag. 2019, 7918765 (2019). https://doi.org/10.1155/2019/7918765. [Google Scholar]
- Mirbagheri G, Crouse D, Dunn K, Bendoym I, Metamaterials based hyperspectral and multi-wavelength filters for imaging applications, in Image Sensing Technologies VI, Proc. SPIE 10980, 29–35 (2019). https://doi.org/10.1117/12.2522262. [Google Scholar]
- Padilla WJ, Averitt RD, Imaging with metamaterials, Nat. Rev. Phys. 4, 85–100 (2022). https://doi.org/10.1038/s42254-021-00394-3. [Google Scholar]
- Cerniauskas G, Sadia H, Alam P, Machine intelligence in metamaterials design: a review, Oxford Open Mater. Sci. 4, 1 (2024). https://doi.org/10.1093/oxfmat/itae001. [Google Scholar]
- Sun S, Dong P, Zhang F, Wang J, Zhu N, Shi Y, Inverse design of ultra-compact multimode waveguide bends based on free-form curves, Laser Photon. Rev. 15, 2100162 (2021). https://doi.org/10.1002/lpor.202100162. [Google Scholar]
- Chen Y, Qiu J, Dong Z, Wang L, Liu Y, Guo H, et al., Inverse design of free-form devices with fabrication-friendly topologies based on structure transformation, J. Lightwave Technol. 41, 4762–4776 (2023). https://doi.org/10.1109/JLT.2023.3242472. [Google Scholar]
- Tsuji Y, Hirayama K, Nomura T, Sato K, Nishiwaki S, Design of optical circuit devices based on topology optimization, IEEE Photon. Technol. Lett. 18, 850–852 (2006). https://doi.org/10.1109/LPT.2006.871686. [Google Scholar]
- Iguchi A, Tsuji Y, Yasui T, Hirayama K, Topology optimal design for optical waveguides using time domain beam propagation method, IEICE Electron. Express 15, 20180417 (2018). https://doi.org/10.1587/elex.15.20180417. [Google Scholar]
- Jakšić Z, Synergy between AI and optical metasurfaces: a critical overview of recent advances, Photonics 11, 442 (2024). https://doi.org/10.3390/photonics11050442. [Google Scholar]
- Anjum N, Hasan R, Performance benchmarking of machine learning models for terahertz metamaterial absorber prediction, arXiv 2508.08611 (2025). https://doi.org/10.48550/arXiv.2508.08611. [Google Scholar]
- Mora A, Herrera-Ramos G, Ramirez-Gutierrez DL, Sanchez-Ante G, Batres R, Roman-Flores A, et al., Modeling and design of architected structures and metamaterials assisted with artificial intelligence, Mater. Res. Express 11, 122002 (2024). https://doi.org/10.1088/2053-1591/ad9dbc. [Google Scholar]
- Lingala S, Singarapu S, Dual-mode THz metamaterial absorber: wideband EMI shielding and narrowband biosensing with machine learning integration, Phys. Scr. 100, 125512 (2025). https://doi.org/10.1088/1402-4896/ae2573. [Google Scholar]
- Han J, Choi J, Park HS, Layout optimization of the grid-shaped metamaterial-based resonators for frequency tuning, Dev. Built Environ. 100823 (2025). https://doi.org/10.1016/j.dibe.2025.100823. [Google Scholar]
- Ma C, Wang Z, Zhang H, Yang F, Chen J, Ren Q, et al., Inverse design of electromagnetic metamaterials: from iterative to deep learning-based methods, J. Micromech. Microeng. 34, 053001 (2024). https://doi.org/10.1088/1361-6439/ad3a72. [Google Scholar]
- Frandsen LH, Elesin Y, Frellsen LF, Mitrovic M, Ding Y, Sigmund O, et al., Topology optimized mode conversion in a photonic crystal waveguide fabricated in silicon-on-insulator material, Opt. Express 22, 8525–8532 (2014). https://doi.org/10.1364/OE.22.008525. [Google Scholar]
- Pita JL, Aldaya I, Dainese P, Hernandez-Figueroa HE, Gabrielli LH, Design of a compact CMOS-compatible photonic antenna by topological optimization, Opt. Express 26, 2435–2442 (2018). https://doi.org/10.1364/OE.26.002435. [Google Scholar]
- Ji W, Chang J, Xu HX, Gao JR, Gröblacher S, Urbach HP, et al., Recent advances in metasurface design and quantum optics applications with machine learning, physics-informed neural networks, and topology optimization methods, Light Sci. Appl. 12, 169 (2023). https://doi.org/10.1038/s41377-023-01218-y. [Google Scholar]
- Jensen JS, Sigmund O, Topology optimization for nano-photonics, Laser Photon. Rev. 5, 308–321 (2011). https://doi.org/10.1002/lpor.201000014. [CrossRef] [Google Scholar]
- Backer AS, Computational inverse design for cascaded systems of metasurface optics, Opt. Express 22, 30308–30330 (2019). https://doi.org/10.1364/OE.27.030308. [Google Scholar]
- Mansouree M, Arbabi A, Metasurface design using level-set and gradient descent optimization techniques, in: Proc. ACES-Miami 2019 (IEEE, 2019). [Google Scholar]
- Nanda S, Sahu PK, Mishra RK, Inverse artificial neural network modeling for metamaterial unit cell synthesis, J. Comput. Electron. 18, 1388–1399 (2019). https://doi.org/10.1007/s10825-019-01371-x. [Google Scholar]
- Chen Y, Zhu J, Xie Y, Feng N, Liu QH, Smart inverse design of graphene-based photonic metamaterials by an adaptive artificial neural network, Nanoscale 11, 9749–9755 (2019). https://doi.org/10.1039/C9NR01315F. [Google Scholar]
- Harper ES, Coyle EJ, Vernon JP, Mills MS, Inverse design of broadband highly reflective metasurfaces using neural networks, Phys. Rev. B 101, 195104 (2020). https://doi.org/10.1103/PhysRevB.101.195104. [Google Scholar]
- Choudhury B, Thomas S, Jha RM, Implementation of soft computing optimization techniques in antenna engineering, IEEE Antennas Propag. Mag. 57, 122–131 (2015). https://doi.org/10.1109/MAP.2015.2439612. [Google Scholar]
- Bacigalupo A, Gnecco G, Lepidi M, Gambarotta L, Machine-learning techniques for the optimal design of acoustic metamaterials, J. Optim. Theory Appl. 187, 630–653 (2020). https://doi.org/10.1007/s10957-019-01614-8. [Google Scholar]
- Beale MH, Hagan MT, Demuth HB, Deep learning toolbox user’s guide (MathWorks, Natick, 2018). [Google Scholar]
- Johnson SG, Joannopoulos JD, Block-iterative frequency-domain methods for Maxwell’s equations in a planewave basis, Opt. Express 8, 173–190 (2001). https://doi.org/10.1364/OE.8.000173. [NASA ADS] [CrossRef] [Google Scholar]
- Oskooi AF, Roundy D, Ibanescu M, Bermel P, Joannopoulos JD, Johnson SG, MEEP: A flexible free-software package for electromagnetic simulations by the FDTD method, Comput. Phys. Commun. 181, 687–702 (2010). https://doi.org/10.1016/j.cpc.2009.11.008. [CrossRef] [Google Scholar]
- Alp İ, Öner BB, Eroğlu E, 285 nm AlGaN-based deep-ultraviolet LED with high internal quantum efficiency: computational design, J. Sci. Rep.-A 052, 51–64 (2023). https://doi.org/10.59313/jsr-a.1195106. [Google Scholar]
- Alp İ, Öner BB, Eroğlu E, Çiftci Y, Quantum efficiency improvement of InGaN near ultraviolet LED design by genetic algorithm, Sakarya Univ. J. Sci. 27, 94–112 (2023). https://doi.org/10.16984/saufenbilder.1051252. [Google Scholar]
- Taflove A, Hagness SC, Piket-May M, Computational electromagnetics: the finite-difference time-domain method, in The Electrical Engineering Handbook (2005), pp. 629–670. [Google Scholar]
- MATLAB, Version 7.10.0 (R2010a) (MathWorks, Natick, 2010). [Google Scholar]
- Wang Y, Pan Z, Yan Y, Yang Y, Zhao W, Ding N, et al., A review of gallium phosphide nanophotonics towards omnipotent nonlinear devices, Nanophotonics 13, 3207–3252 (2024). https://doi.org/10.1515/nanoph-2024-0172. [Google Scholar]
- Haynes WM, CRC Handbook of Chemistry and Physics, 93rd ed. (CRC Press, 2012). [Google Scholar]
- Vidal C, Tilmann B, Tiwari S, Raziman TV, Maier SA, Wenger J, et al., Fluorescence enhancement in topologically optimized gallium phosphide all-dielectric nanoantennas, Nano Lett. 24, 2437–2443 (2024). https://doi.org/10.1021/acs.nanolett.3c03773. [Google Scholar]
- Pozar DM, Microwave Engineering, 4th ed. (John Wiley & Sons, Hoboken, 2012), pp. 26–30. [Google Scholar]
- Piggott AY, Petykiewicz J, Su L, Vučković J, Fabrication-constrained nanophotonic inverse design, Sci. Rep. 7, 1786 (2017). https://doi.org/10.1038/s41598-017-01939-2. [Google Scholar]
- Yamsiri A, Duffy DA, Machin G, Sweeney SJ, Active photonic thermometry using quantum well heterostructures and ring resonators, AIP Conf. Proc. 3230, 110004 (2024). https://doi.org/10.1063/5.0234129. [Google Scholar]
- Komma J, Schwarz C, Hofmann G, Heinert D, Nawrodt R, Thermo-optic coefficient of silicon at 1550 nm and cryogenic temperatures, Appl. Phys. Lett. 101, 041905 (2012). https://doi.org/10.1063/1.4738989. [Google Scholar]
- Nguyen HT, Bui TS, Yan S, Vandenbosch GAE, Lievens P, Vu LD, et al., Broadband negative refractive index obtained by plasmonic hybridization in metamaterials, Appl. Phys. Lett. 109, 221901 (2016). https://doi.org/10.1063/1.4968802. [Google Scholar]
- Briukhanova D, Habib M, Issah I, Caglayan H, Low loss fishnet metamaterial via self-rolled nanotechnology, Appl. Phys. Lett. 119, 141101 (2021). https://doi.org/10.1063/5.0063120. [Google Scholar]
- Islam SS, Faruque MRI, Islam MT, Ali MT, A new wideband negative refractive index metamaterial for dual-band operation, Appl. Phys. A 123, 252 (2017). https://doi.org/10.1007/s00339-016-0737-9. [Google Scholar]
- Ling F, Zhong Z, Huang R, Zhang B, A broadband tunable terahertz negative refractive index metamaterial, Sci. Rep. 8, 9843 (2018). https://doi.org/10.1038/s41598-018-28221-3. [Google Scholar]
- Suzuki T, Sekiya M, Sato T, Takebayashi Y, Negative refractive index metamaterial with high transmission, low reflection, and low loss in the terahertz waveband, Opt. Express 26, 8314–8324 (2018). https://doi.org/10.1364/OE.26.008314. [Google Scholar]
- Rasad A, Yudistira HT, Qalbina F, Saputro AG, Faisal A, Multilayer flexible metamaterials based on circular shape with negative refractive index at microwave spectrum, Sens. Actuators A 332, 113208 (2021). https://doi.org/10.1016/j.sna.2021.113208. [Google Scholar]
All Figures
|
Figure 1 Each unit cell is defined by a randomly generated 8 × 8 square grid, where the black regions represent dielectric material with relative permittivity ε r = 9, and the white regions correspond to vacuum with ε r = 1. |
| In the text | |
|
Figure 2 The input and output values used for group velocity predictions, along with the resulting prediction–actual, residual–prediction, frequency–residual, and residual ratio comparison plots. |
| In the text | |
|
Figure 3 The input and output values used for bandwidth predictions, along with the resulting prediction–actual, residual–prediction, frequency–residual, and residual ratio comparison plots. |
| In the text | |
|
Figure 4 For the optimized result, the normalized frequencies obtained from the Bloch wave solutions are plotted as a function of the wave vector. For the best-performing geometry, the mode profile of the third band corresponding to the normalized frequency ωa⁄2πc = 0.55 is illustrated. |
| In the text | |
|
Figure 5 The steady-state electromagnetic wave distribution in the periodic square lattice pattern of the optimized unit cell. |
| In the text | |
|
Figure 6 The input and output values associated with post-training group velocity predictions obtained using deep learning models, together with the resulting prediction–actual, residual–prediction, frequency–residual, and residual ratio comparison plots. |
| In the text | |
|
Figure 7 The input and output values associated with post-training bandwidth predictions obtained using deep learning models, together with the resulting prediction–actual, residual–prediction, frequency–residual, and residual ratio comparison plots. |
| In the text | |
|
Figure 8 The dispersion distribution for an incident wave with an angle of 0° [arctan(0.0)]. |
| In the text | |
|
Figure 9 The dispersion distribution for an incident wave with an angle of 26.6° [arctan(0.5)]. |
| In the text | |
|
Figure 10 (a) Variation of the group index distributions due to under/over-etching in Band 3. (b) Sensitivity of the response to relative permittivity variations ( |
| In the text | |
|
Figure 11 Spatial distribution of the real part of the Poynting vector (top row) and the corresponding in-plane Poynting vector field (bottom row) for the optimized 4 × 4 symmetric geometry. The colormap illustrates the magnitude and sign of the power flow, while the arrow plots indicate the local energy propagation direction across the unit cell. The results highlight the symmetry-induced field distribution and energy transport characteristics of the structure. (k Γ-M = 125 × 10−3, band: 1; k Γ-M = 5.00 × 10⁻³, band:3; k Γ-M = 125 × 10−3, band: 3. |
| In the text | |
Current usage metrics show cumulative count of Article Views (full-text article views including HTML views, PDF and ePub downloads, according to the available data) and Abstracts Views on Vision4Press platform.
Data correspond to usage on the plateform after 2015. The current usage metrics is available 48-96 hours after online publication and is updated daily on week days.
Initial download of the metrics may take a while.