| Issue |
J. Eur. Opt. Society-Rapid Publ.
Volume 22, Number 1, 2026
|
|
|---|---|---|
| Article Number | 21 | |
| Number of page(s) | 11 | |
| DOI | https://doi.org/10.1051/jeos/2026015 | |
| Published online | 03 April 2026 | |
Research Article
Characterization of subsurface damage in fused silica using non-destructive optical coherence tomography and a destructive approach by iterative plasma jet etching
1
EAH Jena University of Applied Sciences, Department SciTec, Carl-Zeiss-Promenade 2, 07745 Jena, Germany
2
Leibniz Institute of Surface Engineering (IOM), Permoserstraße 15, 04318 Leipzig, Germany
3
Institute of Manufacturing, TU Dresden, 01062 Dresden, Germany
* Corresponding author: This email address is being protected from spambots. You need JavaScript enabled to view it.
Received:
25
November
2025
Accepted:
8
February
2026
Abstract
In this work, a Vickers indenter was used to systematically produce defined and artificial indentations on the surface of fused silica glass to systematically study subsurface damage (SSD). Various measurement methods, such as optical microscopy, white light interferometry (WLI) and optical coherence tomography (OCT), were used to examine SSD depths and morphologies. Tomographic OCT measurements were performed to non-destructively characterize the defects. SSD depths were validated with a destructive preparation method using iterative plasma jet etching (PJE) and subsequent topography measurements with WLI. A total of eight PJE steps were performed to successively remove material, opening and widening surface and subsurface defects. SSD depths in this destructive characterization approach were deduced by combining the PJE etching depth and the corresponding surface roughness parameter Sv. Additionally, measurement methods were verified twice through OCT measurements performed after different etching steps. The increased surface roughness from PJE reduced OCT imaging artifacts and improved the OCT measurement accuracy. The final SSD depth, determined by adding the OCT-measured SSD values after PJE process to the respective PJE etching depth, was highly reliable. The SSD depth of the Vickers indentation determined by the combined use of OCT and PJE showed excellent agreement with the SSD depth estimated using a commonly applied empirical formula for Vickers indentations, providing additional confirmation of the SSD depth and further demonstrated the robustness of the combined OCT-PJE approach.
Key words: Vickers-indented subsurface damage / Optical glass / Fused silica / Optical coherence tomography / Plasma jet etching
© The Author(s), published by EDP Sciences, 2026
 This is an Open Access article distributed under the terms of the Creative Commons Attribution License (https://creativecommons.org/licenses/by/4.0), which permits unrestricted use, distribution, and reproduction in any medium, provided the original work is properly cited.
1 Introduction
Subsurface damage (SSD) is commonly induced during abrasive machining processes such as grinding and lapping. The resulting microcracks, dislocations and residual stress critically affect the performance and reliability of optical components, especially in high-precision or high-power applications [1–7]. Characterization and control of SSD are essential in the optical fabrication process. In recent decades, extensive research has been carried out on the evaluation of SSD using predictive models and measurement techniques, including both destructive and non-destructive methods [8–35]. A commonly used destructive method involves polishing a tapered section to expose the damaged layer, which is then analyzed under a microscope [1, 28, 36]. However, destructive evaluation is time-consuming and lacks the flexibility for real-time or location-specific measurements [37]. Alternative non-destructive tools such as laser-based scattering, acoustic microscopy, fluorescence imaging, x-ray diffraction, and optical coherence tomography (OCT) have also been employed. Each of these methods offers distinct strengths but also limitations [36, 38–49].
Initially developed for biomedical diagnostics, OCT has become a non-destructive tool for subsurface evaluation in a wide range of materials, particularly ceramics and optical glasses [29, 35–37, 50–60]. In a previous work [37], the application of OCT for visualizing the three-dimensional structure of SSD was demonstrated, enabling quantitative analysis of their depth, distribution and damage morphology – critical factors for process optimization and quality control in optical manufacturing [37, 61, 62]. SSD detection using OCT can be limited by imaging artifacts. In regions of low signal intensity, it is challenging to resolve these weak signals and the smallest defects. In a previous study, this issue was addressed by introducing a pre-treatment step involving 30% potassium hydroxide (KOH) etching at 60 °C prior to OCT imaging. This wet chemical etching process was found to reduce imaging artifacts and enhance signal contrast, thereby improving the detectability of SSD features [61].
However, etching rates using 30% KOH at 60° – 0.02 nm/s for polished fused silica and 0.14 nm/s for ground fused silica – necessitate prolonged processing times in this preparation step [61]. Furthermore, the application of KOH requires various safety precautions to overcome its potential risks with respect to working safety and environmental impact. The application of a plasma-based dry etching process features three orders of magnitude higher etching rate (about 450 nm/s) and can reduce the handling risks of wet chemicals mentioned before. In addition, plasma jet etching (PJE) can be locally applied at surface sites of interest, and specific etch depth profiles can be generated [63]. Therefore, an atmospheric-pressure chemically reactive plasma jet was applied for SSD preparation. The Vickers indentation, sharing many characteristics of ordinary indentation, exhibits a typical crack morphology that has been commonly used to study the generation of cracks in optical materials [6, 16, 64–66]. Typically, the analysis of surface and subsurface crack morphology induced by the Vickers indenter is performed using destructive methods. Elfallagh et al. [16] reported 3D FIB (focused ion beam) tomographic analysis of the SSD induced around Vickers indents in soda-lime-silicate glass. After the Vickers indentation tests, Yang [64] measured the SSD of ground ULE-glasses (ultra-low expansion) using the ball-dimple technique. Alternatively, the SSD was investigated by observing the cross-section of the indentations using a scanning electronic microscope [65]. A few research studies have also been conducted to examine the characteristic changes of Vickers-indented glass using non-destructive methods. Sung et al. [67] used digital holographic tomography (DHT) to study the refractive index changes under Vickers indentations in silica, soda-lime, and non-alkaline aluminoborosilicate glasses. Lacondemine et al. [68] directly observed the displacement field and microcracking in glass using X-ray tomography during an in situ Vickers indentation experiment. However, the characterization of SSD in Vickers indentation of fused silica glass using OCT has not been reported in detail to date. In this study, we focus on the quantitative characterization of SSD induced by Vickers indentations in fused silica, using a hybrid approach of PJE and OCT. The stepwise PJE process not only enables controlled material removal while avoiding health risks but is suitable for validating OCT results. Furthermore, PJE improves the imaging conditions for OCT by reducing surface-related artifacts. By integrating both techniques, we aim to establish a reliable method to determine the full depth and morphology of SSD in brittle optical materials. This combined approach is further assessed against empirical estimations and enables the application for precision SSD evaluation in optical manufacturing process chains.
2 Material and methods
2.1 Sample manufacturing using Vickers indentation
Corning Fused Silica HPFS7980 5F (Corning, Inc., denoted by FS) with dimensions of 40 × 40 × 10 mm3 was used in this investigation. The sample surfaces were polished to P3 quality according to the DIN ISO 10110-7 standard. A Vickers testing machine (KB 30 S, KB Prüftechnik GmbH) was used to generate a matrix of Vickers indentations on the FS surface (see Fig. 1), consisting of 19 rows and 10 columns (denoted by R and C). Preliminary tests conducted with this Vickers indenter showed that no SSD was detected up to the application of HV0.4. Therefore, HV0.5 and HV0.6 were used in this study to generate targeted Vickers indentations. Higher loads were avoided, as they produced extensive cracking and non-confined damage, which are unsuitable for localized SSD characterization. Vickers indentations for Columns 1–5 and all 19 rows were made with HV0.5; the remaining Vickers indentations were prepared with HV0.6 given in Figure 1. The loading forces for HV0.5 and HV0.6 are 4.9 N and 5.9 N, respectively. The lateral spacing of the indentations is 1 mm to avoid cracks influencing each other. In order to achieve repeatable measurements and evaluations on the same position, numbers and micro holes are marked using an ultra-short pulsed (USP) laser (TruMicro 5050, Trumpf GmbH & Co. KG) on the sample surface.
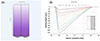 |
Figure 1 (A) Plasma jet etching of fused silica sample prepared with 19 × 10 indentations using different indentation forces (HV0.5 and HV0.6). The indentation positions are further classified according to the Ry-Cx scheme. The orientation of the PJE wedge relative to the indentation matrix is depicted by the purple gradient. (B) Etch profiles along the wedge in y-direction with corresponding row positions of the indentation after eight subsequent PJE steps. |
2.2 SSD preparation by plasma jet etching
Plasma jet machining is a well-established technology for figuring and correcting various designs of optical elements mainly based on silicon containing substrates, such as silicon (Si), fused silica (SiO2) or silicon carbide (SiC) [69–72]. The etching principle is based on chemical interactions between the reactive species generated in the atmospheric-pressure plasma jet discharge and the substrate material of optical glasses. Numerous research work published contain detailed information on PJE and related processes [69, 71, 73–75]. Hence, only some of the key facts of this technology are given here. The plasma jet source is based on a coaxial conductor system. The main process gases He, O2 and CF4 are supplied through the inner conductor whereas nitrogen (N2) is fed peripherally to act as a shield gas. By applying microwave power (f = 2.482 GHz) provided by a microwave generator (PP3030, Trionplas Technologies GmbH) the gas mixture is ignited, by a high-frequency electric field at the nozzle. In the jet-like discharge the CF4 molecules undergo dissociation, excitation and ionization processes to form e.g. highly reactive fluorine species. Those reactive species interact with the sample surface causing the dry etching process. The plasma jet (PJ) source is mounted at a conventional CNC 5-axis motion system (PASO profispeed, PASO Präzisionsmaschinenbau GmbH). A variable material removal at different indentation positions was achieved using a wedge-like areal etch profile of 12.6 × 21.4 mm2. The overlay of the generated indentation matrix and the wedge-like etch profile is depicted in Figure 1, with an increasing etch depth from row 1 to 19 as indicated by the purple color gradient.
This approach similar to taper polishing allows an efficient evaluation of depth-dependent surface morphology information compared to a layer-by-layer removal, though on the expense of statistical validation [1, 28, 36]. Wedge etching was consecutively performed eight times (denoted as PJE #1 to #8), while after each step the surface was characterized by means of topographic and tomographic measurement techniques. After eight PJE steps, a total depth of 110 μm was reached at the deepest point (see Fig. 1). The depth increments rise as the row number increases, so that only about 1 μm was etched in the finest (at row 1) per PJE step, while the largest steps (at row 19) were approx. 13.5 μm each.
2.3 Surface feature characterization
A digital microscope (VHX-7000, Keyence Deutschland GmbH) was used to examine the surface features at each Vickers indentation. A customized ultra-high-resolution optical coherence tomography system (Thorlabs GmbH) was used to acquire tomographic 3D-scans of the surface and subsurface regions. Each Vickers indentation was measured three times – prior to PJE, and after PJE #3 and PJE #5, respectively. The OCT system operates at a central wavelength of 750 nm and provides an axial and lateral resolution of 1.2 μm in air. The interferometric signal is recorded with a spectrometer, processed with ThorImage® to gather 3D raw data and further evaluated using MATLAB®. The methods for evaluation and visualization of OCT results have been described in detail elsewhere [37]. In this work, a SSD area threshold of 0.1 % was applied to overcome the impact of a imaging artefact given by an outlier. This results in SSD depth values including 99.9 % of the pixels of the measured volume. The determination of material removal after PJE is based on areal form measurements using a non-tactile profilometer (CT 350S, Cyber Technologies GmbH). The indentations were analyzed after each PJE step with WLI (NPFlex, Bruker Corp.) to determine the evolution of indentation morphology as well as roughness parameters. Additional measurements using confocal microscope (μsurf explore, NanoFocus AG) were performed for columns 1, 4, 7 and 10 (see Fig. 1) to overcome WLI measurement limitations due to high surface gradients and increased roughness observed for progressive etching depth. The field of view was 231 × 173 μm2 for the WLI, and 320 × 320 μm2 for the confocal microscope, respectively. These measurement areas ensured to capture only a single indentation. Using both WLI and confocal microscopy, the roughness parameter Sv (maximum pit height), and the void volume (VV) of the indentation were analyzed. The latter results from equation (1), where Z is the height value after removing the tilt of the measurement with respect to the surrounding area not influenced by the indentation. (1)
(1)
The matrix arrangement of the indentations and the unambiguous marking allowed to identify the individual measurement positions for all subsequent etching steps in a reproducible manner. The progression of both roughness parameters (Sv, VV) was analyzed as a depth-dependent SSD indicator. In addition, the evolution of the indentation morphology due to PJE was observed using an optical microscope (DSX 1000, Olympus Corp.) in dark field mode (field of view of 485 × 485 μm2).
3 Results and discussion
3.1 Evolution of the Vickers indentation morphology: before and after PJE
First, the surface morphology of the Vickers indentations was analyzed using a digital microscope, as shown in Figure 2. The microscopic view reveals a similar morphology for all indentations and also exhibits some deviations due to the hard-brittle properties. Radial cracks and cone cracks as two typical damages [76, 77] in the area of Vickers indentations are observed on the surface as shown in Figure 2 on indentation R2-C4 (A) and R19-C7 (B).
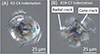 |
Figure 2 Digital microscope image of Vickers indentation (A) R2-C4 (HV0.5) and (B) R19-C7 (HV0.6) in the initial state. |
The length of the diagonals of the Vickers indentations dVickers was measured directly on the Vickers tester. The penetration depth h of the Vickers indenter in the material was calculated using the known geometry of the Vickers indenter according to equation (2). Both values are shown in Table 1.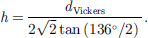 (2)
(2)
Measured diagonal length and calculated penetration depth of Vickers indentations.
The evolution of an exemplary indentation morphology at position R2-C4 is shown in Figure 3 for selected etching depths. In addition to the grayscale images obtained from optical dark field microscopy, the corresponding WLI measurements are shown in false-color for comparison. It can be stated that the first etching attack takes place in the center of the indentation. The central summit, which is apparent in the initial view in Figure 3A, can no longer be observed after etching to a depth of 1.5 μm; instead, a hole-shaped indentation geometry is present in Figure 3B. This shape is retained for the next etching steps. However, in the dark field image, the cone crack that was formed below the surface during the creation of the indentation (see Fig. 3B) becomes more visible. After reaching an etching depth of 10.6 μm the radial expansion of the indentation becomes noticeable, as shown in Figure 3C. It is reasonable to assume that the indentation has opened along the cone crack. The mechanism has not yet been fully clarified, but a kind of “chipping” of the surface due to the etching attack is suspected. Probably, the radial cracks do not influence the evolution of the indentation’s topography in a driving manner, since no example of extension of those cracks after PJE was found.
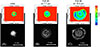 |
Figure 3 Evolution of R2-C4 indentation (HV0.5): microscopic dark field images (grey scale) and WLI measurements (false color) are compared for selected PJE steps with etching depths of d. (A) Indentation prior to PJE and (B)–(D) after PJE steps #5 and #6. |
The fracture behavior of fused silica under Vickers indentation has been extensively investigated to understand SSD mechanisms. Among the observed crack types – radial cracks and cone cracks – cone-shaped cracks typically exhibit the greatest subsurface depth. Hagan et al. [76] experimentally demonstrated that cone cracks initiate near, but outside the contact region of the Vickers indenter and propagate into the bulk material at a characteristic angle, resulting in a subsurface depth significantly exceeding that of other crack types. Lawn and Wilshaw [77] provided a theoretical framework explaining that, due to the brittle nature and minimal plasticity of fused silica, cone cracks form primarily under tensile stresses beyond the contact zone and dominate the subsurface fracture morphology. Li et al. [78] experimentally studied the effects of densification on fracture behavior in fused silica under Vickers indentation. Their results confirmed that cone cracks are the primary crack type, exhibiting greater penetration depths than other cracks, thus reinforcing the critical role of cone cracks in SSD. Tomić et al. [79] further supported these findings trough numerical phase-field modeling, simulating the initiation and propagation of cone cracks from the contact periphery into the bulk. Their results emphasized the dominant role of cone cracks in subsurface damage generation by indentation. Michel et al. [80] investigated the effect of temperature on hardness and indentation cracking in fused silica, finding that cone cracks consistently form as the earliest and deepest cracks across a broad temperature range. Collectively, these experimental, theoretical, and numerical studies converge on the conclusion that cone-shaped cracks generated by Vickers indentation in fused silica generally exhibit the greatest subsurface depth. OCT-based 3D imaging results confirm this behavior, revealing that cone cracks coincide with the deepest SSD induced by Vickers indentation in fused silica, where the SSD exhibits a ring-like distribution, as illustrated in Figures 4B and 4C. The measured SSD99.9 values in the initial state, after PJE #3, and after PJE #5 – including the PJE removal depth as determined by OCT – were 32.6 μm, 34.7 μm, and 34.1 μm, respectively. Based on these measurements, the greatest penetration depth of the cone crack at indentation R2-C4 is estimated to be approximately 33.8 μm, representing the average of the three values.
 |
Figure 4 3D representations of OCT measurements of the R2-C4 indentation (HV0.5): (A) initial state, (B) after PJE step #3, and (C) after PJE step #5. |
A similar picture is obtained when looking at the R19-C7 indentation. The most extensive etching steps were achieved in row 19 (see Fig. 1). Thus, in dark field microscopy presented in Figure 5, the expansion along the cone crack can already be seen after a removal of 27.0 μm. The result is interpreted as preferential and hence anisotropic etching of the morphologically distorted surface, while isotropic etching is assumed for bulk material. The latter takes place in the subsequent steps, where the indentation increases laterally with increasing etching depth. After an etching depth of approx. 83.3 μm, shown in Figure 5, the inner structure of the indentation can no longer be recognized. In applied DF microscopy, scattered or reflected light is directed obliquely onto the sample surface. This highlights scratches and near-surface damage causing them to appear bright.
 |
Figure 5 Evolution of R19-C7 indentation (HV0.6): microscopic dark field images are shown for selected PJE process steps with etching depths of d. (A) Indentation prior to PJE. (B)–(D) Indentation after PJE steps #2, #3, and #6. |
3.2 Evolution of SSD and the roughness parameter Sv
All 190 Vickers indentations – measured before PJE, as well as after PJE #3 and PJE #5 – were recorded using OCT and evaluated with MATLAB®. The evaluation procedure involved preprocessing the OCT signals to reduce noise, followed by segmentation of the indentation profiles. Key parameters such as indentation depth and lateral dimensions were then extracted for quantitative analysis and visualization. The final SSD depth given in Figure 6 considering the removal d of the PJE was calculated by![Mathematical equation: $$ \mathrm{SSD}\enspace \left[\mathrm{\mu m}\right]={\mathrm{SSD}}_{99.9}+{d}. $$](/articles/jeos/full_html/2026/01/jeos20250087/jeos20250087-eq5.gif) (3)
(3)
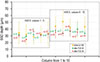 |
Figure 6 SSD depth of Vickers indentations for different process states measured by OCT considering the PJE removal depth (n indicates the number of measurements for each column). |
As an example of the OCT analysis, Vickers indentation R2-C4 is presented in Figure 7. The color-coded depth maps as top views on the sample indicate the local SSD depths relative to the surface for each specific measurement. The determined SSD99.9 values differ by only a few micrometers, which corresponds well with the material removal depths achieved by the PJE process. For column 2, the removal depths after PJE #3 and PJE #5 were approximately 5.0 μm and 7.7 μm, respectively. Due to the applied area threshold of 0.1% the given maximum of the color scale is higher than the SSD99.9 values obtained. As shown in Figure 7A, the maximum SSD depth of the initial indentation was 53.0 μm is due an imaging artifact, which is not included in the given evaluation threshold.
 |
Figure 7 Color-coded depth maps of the subsurface damage determined by OCT-measurements for Vickers indentation R2-C4 (HV0.5): (A) initial state, (B) after PJE step #3, and (C) after PJE step #5. |
As the wedge etching removal increased from row 1 to 19, as shown in Figure 6, fewer SSD was detected with OCT (given by n), as more defects were eliminated during the PJE process, particularly starting from row 10. After PJE #3, the mean SSD depths for Vickers indentation made with HV0.5 and HV0.6 were 31.1 ± 3.7 μm and 36.4 ± 6.7 μm, respectively. This trend was confirmed after PJE #5, where similar mean SSD depths were observed, as shown in Table 2.
SSD depths of Vickers indentations (HV0.5 and HV0.6) measured by OCT considering the PJE removal depth at various processing steps.
As a plausibility check, the SSD measurements are compared with distinct experiments from literature. Experimental data published by Suratwala et al. [81] includes directly comparable crack depths measured in Vickers experiments with HV0.5, yielding crack depths of 35.9 μm which aligns well with our measurement results listed in Table 2. The experiments conducted by Michel et al. [80] also show excellent agreement in both size and distribution, reporting a crack depth of 33 ± 7 μm for indentation tests under a load of 5 N at 20 °C.
To further validate the OCT measurements, the evolution of SSD depth was additionally determined depending on etching depth resulting from wedge etching. As described in Section 2.3 the progress of the void volume VV of the indentation and the roughness parameter Sv were analyzed. VV rises with increasing etching depth, which is expected from the chemical etching processes. However, the increase is non-uniform during the whole process. Figure 8 presents this progress exemplary for three indentations. The calculation of the slope using equation (4), where VV is the void volume and d the etching depth reveals a prominent peak that can be observed for every indentation. (4)
(4)
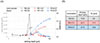 |
Figure 8 Determination of SSD depth after PJE: (A) Etch dependency of void volume and slope determination for three indentations. (B) Etching depth and Sv of the maximum slope position. |
As shown in the section before, the morphology of the indentation changes significantly. Obviously, anisotropic etching behavior prevails as long as SSD is present. So far, it is postulated that the significant increase of the void volume at a specific etching depth indicates the influence of disturbance in the material, emerging from SSD. The morphological evaluation is shown exemplary in the previous section, where the volumetric extension is visualized in Figures 3B–3C. This behavior is comparable to the findings in wet chemical etching, where anisotropic etching of the disturbed material was detected as well [82–84]. After the complete removal of SSD isotropic etching continues and the slope shown in Figure 8A approaches zero.
Thus, the SSD depth can be estimated by taking the Sv value measured at the etching depth d where the maximum slope of VV occurs, as indicated by equation (5):![Mathematical equation: $$ \mathrm{SSD}\enspace \left[\mathrm{\mu m}\right]={Sv}\enspace \left\{\mathrm{max}\left(\mathrm{slope}{VV}\right)\right\}+{d}\enspace \left\{\mathrm{max}\left(\mathrm{slope}{VV}\right)\right\}. $$](/articles/jeos/full_html/2026/01/jeos20250087/jeos20250087-eq7.gif) (5)
(5)
Based on this calculation, the SSD depth is determined for the four selected columns. The results are compared in Figure 9 with the SSD depth values measured by OCT in the initial state, after PJE #3 and PJE #5. The OCT results obtained after PJE are in better agreement with the values calculated by equation (5). This is mainly caused by surface roughening and suppression of OCT measurement artifacts, thus yielding a higher accuracy.
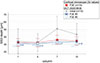 |
Figure 9 SSD depth measured with OCT in comparison to SSD depth determination based on surface roughness Sv value and applying equation (5). (n indicates the number of measurements each column). |
However, deep etching is not beneficial for a higher precision of the OCT measurements. After PJE #5 SSD is only measurable on a few indentation positions (see reduction of parameter n). Thus, SSD depth values are statistically less reliable.
4 Conclusion
In this work, Vickers indentations were applied to fused silica samples, enabling the controlled and reproducible generation of localized SSD regions with well-defined geometry and thus providing a standardized model for systematic investigations of SSD depth. Non-destructive optical coherence tomography (OCT) was applied to characterize SSD depths and the morphology of surface defects induced by indentation.
In order to validate the OCT results, a destructive reference method based on iterative plasma jet etching (PJE) and topographic measurements to determine the evolution of the surface roughness parameter Sv and deriving SSD depths has been established. Although the SSD depths determined using both methods show sufficient correlation, the SSD depths measured by OCT exhibit a greater data dispersion.
Therefore, a novel hybrid approach combining PJE and OCT was employed to characterize SSD induced by Vickers indentation in fused silica glass. The experimental workflow involves selectively removing surface layers using PJE to expose the damage morphology, and performing high-resolution, 3D imaging and depth analysis via OCT. The results demonstrate that this combined approach enables reliable and even more accurate quantification of SSD depth and morphology.
The proposed hybrid methodology has important applications in both academic research and industrial practice, particularly in precision optical manufacturing. Accurate detection and quantification of SSD in fused silica and other brittle optical materials is essential for ensuring the performance, durability, and reliability of high-quality optical components, such as lenses, optical fibers, and glass-based devices. Subsurface defects can significantly affect optical performance and mechanical stability, making reliable SSD evaluation a critical requirement. From an academic perspective, this study contributes to a deeper understanding of SSD formation in hard and brittle materials. The combined use of Vickers indentation, OCT, and PJE provides a robust framework for investigating SSD with improved accuracy and can be used as a calibration tool for SSD analysis. From an industrial standpoint, the proposed method shows strong potential for quality control and process optimization in optical component manufacturing. PJE offers additional measurement benefits for OCT and an additional evaluation method based on the proposed roughness analysis. These findings are directly applicable to specific process chains in precision optics manufacturing, particularly where plasma and ion-beam techniques are already employed.
A direct comparison of SSD depths determined in this study with those measured in Vickers experiments by Suratwala et al. [81] and Michel et al. [80] shows an excellent agreement with previously recorded crack depths under similar experimental conditions.
Furthermore, this study experimentally confirms the dominant role of cone cracks in the formation of deep SSD in fused silica. Previous theoretical, experimental, and numerical studies have consistently shown that cone cracks initiate near the periphery of the contact zone and propagate into the bulk material at a characteristic angle, exhibiting significantly greater penetration depths than radial or lateral cracks. OCT-based analysis in this work reveals that the regions of maximum SSD depth correspond to the typical propagation paths of cone cracks, reaffirming their critical role in subsurface damage generation.
In summary, the developed hybrid method provides an effective and precise tool for the identification and quantification of SSD caused by Vickers indentation, particularly those governed by cone crack propagation. This approach holds substantial promise for applications in precision optical manufacturing, where the ability to detect and control subsurface defects is essential for improving the quality and reliability of optical components.
Funding
This research was funded by the German Federal Ministry for Economic Affairs and Climate Action (BMWK) within the Promotion of Joint Industrial Research Program (IGF) due to a decision of the German Bundestag. It was part of the research project 01IF22724N by the Association for Research in Precision Mechanics, Optics and Medical Technology (F.O.M.) under the auspices of the DLR Projektträger (DLR-PT). The authors gratefully acknowledge financial support by the Free State of Thuringia and the European Union (EFRE – European Regional Development Fund and REACT-EU) – grant no. 2021 FGI 0021.
Conflicts of interest
The authors declare that they have no competing interests.
Data availability statement
All data generated or analyzed during this study are included in this published article.
Author contribution statement
TA and JB acquired the funding and conceptualized as well as managed the research. SF, HM and WZ wrote the original draft. WZ prepared the initial samples using Vickers indentation. SF and WZ performed OCT and DM measurements. DT and SF carried out OCT evaluations. HM performed the plasma jet etching, WLI and DM measurements. All authors were involved in methodology design and data evaluation as well as editing the manuscript. The authors have read and approved the final manuscript.
References
- Hed, PP, Edwards, DF, Davis, JB, in Proceedings of the optical fabrication and testing, Santa Clara, 1988 (Optica Publishing Group, Washington, D.C., 1988), paper WC1. https://doi.org/10.1364/OFT.1988.WC1. [Google Scholar]
- Preston, FW, The structure of abraded glass surfaces, Trans. Opt. Soc. 23, 141 (1922). https://doi.org/10.1088/1475-4878/23/3/301. [NASA ADS] [CrossRef] [Google Scholar]
- Moses, EI, in Proceedings of the 20th IEEE/NPSS Symposium on Fusion Engineering, San Diego, 2003 (IEEE, 2003), p. 413. https://doi.org/10.1109/FUSION.2003.1426672. [Google Scholar]
- Campbell, JH, Hawley-Fedder, RA, Stolz, CJ, Menapace, JA, Borden, MR, Whitman, PK, et al., in Proceedings of the Lasers and Applications in Science and Engineering, San Jose, 2004, edited by Lane, MA. and Wuest, CR. (Proceedings Volume 5341, Optical Engineering at the Lawrence Livermore National Laboratory II: The National Ignition Facility, San Jose, 2004), p. 84. https://doi.org/10.1117/12.538471. [Google Scholar]
- Wang, H, Ma, Y, Peng, G, Hang, W, Jiang, W, Chen, H, et al., Evaluation of subsurface damage layer of BK7 glass via cross-sectional surface nanoindentation, Precis. Eng. 67, 293 (2021). https://doi.org/10.1016/j.precisioneng.2020.10.008. [Google Scholar]
- Jiao, P, Xin, Q, Fan, B, Wu, Y, Wu, X, Morphology evolution of Vickers indentation in fused silica glass etched by atmospheric pressure plasma jet, Ceram. Int. 48, 31500 (2022). https://doi.org/10.1016/j.ceramint.2022.07.069. [Google Scholar]
- Hu, G, Zhao, Y, Liu, X, Li, D, Xiao, Q, Yi, K, Shao, J, Combining wet etching and real-time damage event imaging to reveal the most dangerous laser damage initiator in fused silica, Opt. Lett. 38, 2632 (2013). https://doi.org/10.1364/OL.38.002632. [Google Scholar]
- Lambropoulos, JC, Li, Y, Funkenbusch, PD, Ruckman, JL, in Proceedings of the SPIE’s International Symposium on Optical Science, Engineering, and Instrumentation, Denver, CO, 1999 (SPIE, 1999), p. 41. https://doi.org/10.1117/12.369213. [Google Scholar]
- Fine, KR, Garbe, R, Gip, T, Nguyen, Q, in Proceedings of the Defense and Security, Orlando, 2005 (SPIE, 2005), p. 105. https://doi.org/10.1117/12.602993. [Google Scholar]
- Liu, H, Ye, X, Zhou, X, Huang, J, Wang, F, Zhou, X, et al., Subsurface defects characterization and laser damage performance of fused silica optics during HF-etched process, Opt. Mate. 36, 855 (2014). https://doi.org/10.1016/j.optmat.2013.11.022. [Google Scholar]
- Lakhdari, F, Belkhir, N, Bouzid, D, Herold, V, Relationship between subsurface damage depth and breaking strength for brittle materials, Int. J. Adv. Manuf. Technol. 102, 1421 (2019). https://doi.org/10.1007/s00170-018-03284-8. [Google Scholar]
- Zhou, Y, Funkenbusch, PD, Quesnel, DJ, Golini, D, Lindquist, A, Effect of Etching and Imaging Mode on the Measurement of Subsurface Damage in Microground Optical Glasses, J. Am. Ceram. Soc. 77, 3277 (1994). https://doi.org/10.1111/j.1151-2916.1994.tb04585.x. [CrossRef] [Google Scholar]
- Lucca, DA, Wetteland, CJ, Misra, A, Klopfstein, MJ, Nastasi, M, Maggiore, CJ, Tesmer, JR, Assessment of subsurface damage in polished II–VI semiconductors by ion channeling, Nucl. Instrum. Meth. Phys. Res. B 219–220, 611 (2004). https://doi.org/10.1016/j.nimb.2004.01.129. [Google Scholar]
- Menapace, JA, Davis, PJ, Steele, WA, Wong, LL, Suratwala, TI, Miller, PE, in Proceedings of the Boulder Damage Symposium XXXVII: Annual Symposium on Optical Materials for High Power Lasers, Boulder, 2005 (SPIE, 2005), p. 599103. https://doi.org/10.1117/12.638839. [Google Scholar]
- Shafrir, SN, Lambropoulos, JC, Jacobs, SD, Subsurface damage and microstructure development in precision microground hard ceramics using magnetorheological finishing spots, Appl. Opt. 46, 5500 (2007). https://doi.org/10.1364/AO.46.005500. [Google Scholar]
- Elfallagh, F, Inkson, BJ, 3D analysis of crack morphologies in silicate glass using FIB tomography, J. Eur. Ceram. Soc. 29, 47 (2009). https://doi.org/10.1016/j.jeurceramsoc.2008.05.042. [Google Scholar]
- Neauport, J, Cormont, P, Legros, P, Ambard, C, Destribats, J, Imaging subsurface damage of grinded fused silica optics by confocal fluorescence microscopy, Opt. Express 17, 3543 (2009). https://doi.org/10.1364/OE.17.003543. [CrossRef] [Google Scholar]
- Wang, C, Tian, A, Wang, H, Li, B, Jiang, Z, in Proceedings of the Fourth International Conference on Experimental Mechanics, Singapore, 2009 (SPIE, 2009), 75226K. https://doi.org/10.1117/12.852363. [Google Scholar]
- Neauport, J, Ambard, C, Cormont, P, Darbois, N, Destribats, J, Luitot, C, Rondeau, O, Subsurface damage measurement of ground fused silica parts by HF etching techniques, Opt. Express 17, 20448 (2009). https://doi.org/10.1364/OE.17.020448. [NASA ADS] [CrossRef] [Google Scholar]
- Sergeeva, M, Khrenikov, K, Hellmuth, T, Boerret, R, Sub surface damage measurements based on short coherent interferometry, J. Eur. Opt. Soc. Rapid. Publ. 5, 10003 (2010). https://doi.org/10.2971/jeos.2010.10003. [Google Scholar]
- Li, Y, Huang, H, Xie, R, Li, H, Deng, Y, Chen, X, et al., A method for evaluating subsurface damage in optical glass, Opt. Express 18, 17180 (2010). https://doi.org/10.1364/OE.18.017180. [CrossRef] [Google Scholar]
- Ma, B, Shen, Z, He, P, Ji, Y, Sang, T, Jiao, H, et al., Subsurface quality of polished SiO2 surface evaluated by quasi-Brewster angle technique, Optik. 122, 1418 (2011). https://doi.org/10.1016/j.ijleo.2010.09.019. [Google Scholar]
- Ma, B, Shen, Z, He, P, Sha, F, Wang, C, Wang, B, et al., Evaluation and analysis of polished fused silica subsurface quality by the nanoindenter technique, Appl. Opt. 50, C279–C285 (2011). https://doi.org/10.1364/AO.50.00C279. [Google Scholar]
- Trost, M, Herffurth, T, Schmitz, D, Schröder, S, Duparré, A, Tünnermann, A, Evaluation of subsurface damage by light scattering techniques, Appl. Opt. 52, 6579 (2013). https://doi.org/10.1364/AO.52.006579. [Google Scholar]
- Aida, H, Takeda, H, Kim, S-W, Aota, N, Koyama, K, Yamazaki, T, Doi, T, Evaluation of subsurface damage in GaN substrate induced by mechanical polishing with diamond abrasives, Appl. Surf. Sci. 292, 531 (2014). https://doi.org/10.1016/j.apsusc.2013.12.005. [Google Scholar]
- Li, HN, Yu, TB, Da Zhu, L, Wang, WS, Evaluation of grinding-induced subsurface damage in optical glass BK7, J. Mater. Process. Technol. 229, 785 (2016). https://doi.org/10.1016/j.jmatprotec.2015.11.003. [Google Scholar]
- Luo, J, Huynh, H, Pantano, CG, Kim, SH, Hydrothermal reactions of soda lime silica glass – Revealing subsurface damage and alteration of mechanical properties and chemical structure of glass surfaces, J. Non-Cryst. Solids 452, 93 (2016). https://doi.org/10.1016/j.jnoncrysol.2016.08.021. [Google Scholar]
- Seiler, M, Tianis, L, Bliedtner, J, Berlinger, M, Gürtler, S, in Proceedings of the Conferences on Optical Technologies, München, 2019 (EPJ Web Conferences 215, Les Ulis, 2019), p. 08001. https://doi.org/10.1051/epjconf/201921508001. [Google Scholar]
- Wu, X, Gao, W, He, Y, Liu, H, Quantitative measurement of subsurface damage with self-referenced spectral domain optical coherence tomography, Opt. Mater. Express 7, 3919 (2017). https://doi.org/10.1364/OME.7.003919. [Google Scholar]
- Schnurbusch, G, Brinksmeier, E, Riemer, O, Influence of cutting speed on subsurface damage morphology and distribution in ground fused Silica, Inventions 2, 15 (2017). https://doi.org/10.3390/inventions2030015. [Google Scholar]
- Trum, CJ, Vogt, C, Sitzberger, S, Rascher, R, Faehnle, O, in Proceedings of the Fifth European Seminar on Precision Optics Manufacturing, Teisnach, 2018, edited by Rascher, R. and Schopf, C. (Proceedings Volume 10826, SPIE, 2018), p. 11. https://doi.org/10.1117/12.2318576. [Google Scholar]
- Yin, J, Bai, Q, Haitjema, H, Zhang, B, Two-dimensional detection of subsurface damage in silicon wafers with polarized laser scattering, J. Mater. Process. Technol. 284, 116746 (2020). https://doi.org/10.1016/j.jmatprotec.2020.116746. [Google Scholar]
- Liu, J, Liu, J, Liu, C, Wang, Y, 3D dark-field confocal microscopy for subsurface defects detection, Opt. Lett. 45, 660 (2020). https://doi.org/10.1364/OL.384487. [Google Scholar]
- Miller, PE, Suratwala, TI, Wong, LL, Feit, MD, Menapace, JA, Davis, PJ, Steele, RA., in Proceedings of the Boulder Damage Symposium XXXVII: Annual Symposium on Optical Materials for High Power Lasers, Boulder, 2005, edited by Gregory, JE., Arthur, HG., Keith, LL., Detlev, R., Soileau, MJ., Christopher, JS. (Proceedings Volume 5991, SPIE 2005), p. 599101. https://doi.org/10.1117/12.638821. [Google Scholar]
- Börret, R, Wiedemann, D, Kelm, A, in Proceedings of the 58th Ilmenau Scientific Colloquium (Technical University of Ilmenau, Ilmenau, 2014). https://nbn-resolving.org/urn:nbn:de:gbv:ilm1-2014iwk-199:0. [Google Scholar]
- Cui, Y, Wang, C, Liu, X, Wu, Y, Li, Z, Li, R, He, W, A review of subsurface damage detection methods for optical components, AIP Adv. 13, (2023). https://doi.org/10.1063/5.0151498. [Google Scholar]
- Frank, S, Seiler, M, Bliedtner, J, Three-dimensional evaluation of subsurface damage in optical glasses with ground and polished surfaces using FF-OCT, Appl. Opt. 60, 2118 (2021). https://doi.org/10.1364/AO.413090. [CrossRef] [PubMed] [Google Scholar]
- Shen, J, Liu, S, Yi, K, He, H, Shao, J, Fan, Z, Subsurface damage in optical substrates, Optik 116, 288 (2005). https://doi.org/10.1016/j.ijleo.2005.02.002. [NASA ADS] [CrossRef] [Google Scholar]
- Lu, W, Pei, ZJ, Sun, JG, Non-destructive evaluation methods for subsurface damage in silicon wafers: a literature review, IJMMM 2, 125 (2007). https://doi.org/10.1504/IJMMM.2007.012672. [Google Scholar]
- Wang, J, Li, YG, Han, JH, Xu, Q, Guo, YB, Evaluating subsurface damage in optical glasses, J. Eur. Opt. Society-Rapid Publ. 6, (2011). https://doi.org/10.1051/jeos.2011.11001. [Google Scholar]
- Yin, J, Bai, Q, Zhang, B, Methods for detection of subsurface damage: a review, Chin. J. Mech. Eng. 31, (2018). https://doi.org/10.1186/s10033-018-0229-2. [Google Scholar]
- Frank, S, Schwörer, L, Alvan, V, Hohmann, P, Burger, I, Jedamzik, S, et al., in Proceedings of the Eleventh European Seminar on Precision Optics Manufacturing, Teisnach, 2024, edited by Fütterer, G., Wünsche, C., Fähnle, OW., Thieß, H. and Ahaberl, A. (Proceedings Volume 13221, SPIE, 2024), p. 5. https://doi.org/10.1117/12.3031491. [Google Scholar]
- Frank, S, Reichenbächer, M, Seiler, M, Arnold, T, Bliedtner, J, in Proceedings of the EOSAM 2023, Dijon, 2023 (EPJ Web Conferences 287, Les Ulis, 2023), p. 5024. https://doi.org/10.1051/epjconf/202328705024. [Google Scholar]
- Hu, Y, Gao, W, Detecting subsurface damage within glasses with polarization-sensitive optical coherence tomography, Opt. Laser Technol. 177, 111146 (2024). https://doi.org/10.1016/j.optlastec.2024.111146. [Google Scholar]
- Ou, L, He, H, Wang, F, Sun, L, Yu, J, Recent advances in the characterization of subsurface damage in optical materials, Materials (Basel) 18, (2025). https://doi.org/10.3390/ma18163883. [Google Scholar]
- Thelemann, D, Frank, S, Schneider, K, Henkel, S, Schulze, C, Bliedtner, J, in Proceedings of the Twelfth European Seminar on Precision Optics Manufacturing, Teisnach, 2025, edited by Fütterer, G., Wünsche, C., Fähnle, OW., Thieß, H. and Ahaberl, A. (Proceedings Volume 13789, SPIE, 2025), p. 7. https://doi.org/10.1117/12.3075984. [Google Scholar]
- Seiler, M, Frank, S, Thelemann, D, Elies, O, Teymori, P, Bliedtner, J, How laser material processing can benefit from OCT technology, Photonics Views 22, 52 (2025). https://doi.org/10.1002/phvs.202400037. [Google Scholar]
- Nie, J, Wang, Y, Wang, D, Ding, Y, Zhou, C, Wang, J, et al., Method for extracting optical element information using optical coherence tomography, Sensors (Basel) 24, 6953 (2024). https://doi.org/10.3390/s24216953. [Google Scholar]
- Wang, L, Fu, R, Xu, C, Xu, M, Methods and applications of full-field optical coherence tomography: a review, J. Biomed. Opt. 27, 050901(2022). https://doi.org/10.1117/1.JBO.27.5.050901. [Google Scholar]
- Huang, D, Swanson, EA, Lin, CP, Schuman, JS, Stinson, WG, Chang, W, et al., Optical coherence tomography, Science 254, 1178 (1991). https://doi.org/10.1126/science.1957169. [CrossRef] [PubMed] [Google Scholar]
- Stifter, D, Beyond biomedicine: a review of alternative applications and developments for optical coherence tomography, Appl. Phys. B 88, 337 (2007). https://doi.org/10.1007/s00340-007-2743-2. [NASA ADS] [CrossRef] [Google Scholar]
- Fujimoto, J, Swanson, E, The development, commercialization, and impact of optical coherence tomography, invest. Ophthalmol. Vis. Sci. 57, OCT1–OCT13 (2016). https://doi.org/10.1167/iovs.16-19963. [Google Scholar]
- Su, R, Kirillin, M, Chang, EW, Sergeeva, E, Yun, SH, Mattsson, L, Perspectives of mid-infrared optical coherence tomography for inspection and micrometrology of industrial ceramics, Opt. Express 22, 15804 (2014). https://doi.org/10.1364/OE.22.015804. [Google Scholar]
- Sakamoto, F, Takahashi, T, Tatami, J, Iijima, M, Prediction of strength based on defect analysis in Al2O3 ceramics via non-destructive and three-dimensional observation using optical coherence tomography, J. Ceram. Soc. Japan 127, 462 (2019). https://doi.org/10.2109/jcersj2.19020. [Google Scholar]
- Toyokura, S, Contactless mapping of ceramic green density using optical coherence tomography, Open Ceram. 5, 100061 (2021). https://doi.org/10.1016/j.oceram.2021.100061. [Google Scholar]
- Takahashi, T, Sakamoto, F, Tatami, J, Iijima, M, In situ observation of evolution of internal structure of alumina during sintering by swept‐source OCT, Int. J. Appl. Ceram. Technol. 19, 1171 (2022). https://doi.org/10.1111/ijac.13909. [Google Scholar]
- Kopycinska-Müller, M, Schreiber, L, Schwarzer-Fischer, E, Günther, A, Phillips, C, Moritz, T, et al., Signal-decay based approach for visualization of buried defects in 3-D printed ceramic components imaged with help of optical coherence tomography, Materials 16, 3607 (2023). https://doi.org/10.3390/ma16103607. [Google Scholar]
- Chen, Z, Shen, Y, Bao, W, Li, P, Wang, X, Ding, Z, Identification of surface defects on glass by parallel spectral domain optical coherence tomography, Opt. Express 23, 23634 (2015). https://doi.org/10.1364/OE.23.023634. [Google Scholar]
- Guss, G, Bass, I, Hackel, R, Mailhiot, C, Demos, SG, in Proceedings of the Boulder Damage Symposium XXXIX: Annual Symposium on Optical Materials for High Power Lasers, Boulder, 2007, edited by Gregory, JE., Arthur, HG., Keith, LL., Detlev, R., Soileau, MJ., Christopher, JS. (Proceedings Volume 6720, SPIE, 2007), p. 67201F. https://doi.org/10.1117/12.748452. [Google Scholar]
- Hou, F, Zhang, M, Zheng, Y, Ding, L, Tang, X, Liang, Y, Detection of laser-induced bulk damage in optical crystals by swept-source optical coherence tomography, Opt. Express 27, 3698 (2019). https://doi.org/10.1364/OE.27.003698. [Google Scholar]
- Frank, S, Zhang, W, Thelemann, D, Elies, O, Arnold, T, Bliedtner, J, in Proceedings of the EOSAM 2024, Neapel, 2024 (EPJ Web Conferences 309, Les Ulis, 2024), p. 3010. https://doi.org/10.1051/epjconf/202430903010. [Google Scholar]
- Frank, S, Reichenbächer, M, Seiler, M, Thelemann, D, Arnold, T, Bliedtner, J, Revealing subsurface damage morphology and patterns in areal ultrashort pulse laser machining of glass, Lasers Manuf. Mater. Proc. 11, 631 (2024). https://doi.org/10.1007/s40516-024-00262-9. [Google Scholar]
- Müller, H, Arnold, T, in Proceedings of the Twelfth European Seminar on Precision Optics Manufacturing, Teisnach, 2025, edited by Fütterer, G., Wünsche, C., Fähnle, OW., Thieß, H. and Ahaberl, A. (Proceedings Volume 13789, SPIE, 2025), p. 5. https://doi.org/10.1117/12.3074295. [Google Scholar]
- Yang, F, Effect of subsurface damage on indentation behavior of ground ULE™ glass, J. non-Cryst. Solids 351, 3861 (2005). https://doi.org/10.1016/j.jnoncrysol.2005.10.022. [Google Scholar]
- Yao, P, Wang, W, Huang, CZ, Wang, J, Zhu, HT, Kuriyagawa, T, Indentation crack initiation and ductile to brittle transition behavior of fused Silica, AMR 797, 667 (2013). https://doi.org/10.4028/www.scientific.net/AMR.797.667. [Google Scholar]
- Weeks, WP, Flores, KM, Improving the precision of Vickers indentation measurements in soda-lime glass with increased dwell time, J. Non-Cryst. Solids 605, 122174 (2023). https://doi.org/10.1016/j.jnoncrysol.2023.122174. [Google Scholar]
- Sung, Y, Yoshida, S, Kato, Y, Kurkjian, C, Three‐dimensional densification measurement of Vickers‐indented glass using digital holographic tomography, J. Am. Ceram. Soc. 102, 5866 (2019). https://doi.org/10.1111/jace.16508. [Google Scholar]
- Lacondemine, T, Réthoré, J, Maire, É, Célarié, F, Houizot, P, Roux-Langlois, C, et al., Direct observation of the displacement field and microcracking in a glass by means of X-ray tomography during in situ Vickers indentation experiment, Acta Mater. 179, 424 (2019). https://doi.org/10.1016/j.actamat.2019.07.053. [Google Scholar]
- Arnold, T, Boehm, G, Eichentopf, I-M, Janietz, M, Meister, J, Schindler, A, Plasma jet machining, Vak. Forsch. Prax. 22, 10 (2010). https://doi.org/10.1002/vipr.201000423. [Google Scholar]
- Arnold, T, Boehm, G, Paetzelt, H, New freeform manufacturing chains based on atmospheric plasma jet machining, J. Eur. Opt. Soc.-Rapid Publ. 11, 16002 (2016). https://doi.org/10.2971/jeos.2016.16002. [Google Scholar]
- Arnold, T, Böhm, G, Paetzelt, H, Ultra‐precision surface machining with reactive plasma jets, Contrib. Plasma Phys. 54, 145 (2014). https://doi.org/10.1002/ctpp.201310058. [NASA ADS] [CrossRef] [Google Scholar]
- Müller, H, Böhm, G, Arnold, T, in Proceedings of the Sixth European Seminar on Precision Optics Manufacturing, Teisnach, 2019, edited by Rascher, R. and Schopf, C. (Proceedings Volume 11171, SPIE, 2019), p. 21. https://doi.org/10.1117/12.2526746. [Google Scholar]
- Arnold, T, Böhm, G, Fechner, R, Meister, J, Nickel, A, Frost, F, et al., Ultra-precision surface finishing by ion beam and plasma jet techniques – status and outlook, Nucl. Instrum. Methods Phys. Res. A 616, 147 (2010). https://doi.org/10.1016/j.nima.2009.11.013. [Google Scholar]
- Müller, H, Waak, T, Birnbaum, U, Böhm, G, Arnold, T, Atmospheric plasma jet processing for figure error correction of an optical element made from S-BSL7, J. Eur. Opt. Soc.-Rapid Publ. 18, 4 (2022). https://doi.org/10.1051/jeos/2022003. [Google Scholar]
- Kazemi, F, Boehm, G, Arnold, T, An investigation on effectiveness of temperature treatment for fluorine‐based reactive plasma jet machining of N‐BK7®, Plasma Process. Polym. 17 (2020). https://doi.org/10.1002/ppap.202000016. [Google Scholar]
- Hagan, JT, Cone cracks around Vickers indentations in fused silica glass, J. Mater. Sci. 14, 462 (1979). https://doi.org/10.1007/BF00589840. [Google Scholar]
- Lawn, B, Wilshaw, R, Indentation fracture: principles and applications, J. Mater. Sci. 10, 1049 (1975). https://doi.org/10.1007/BF00823224. [Google Scholar]
- Li, C, Ding, J, Zhang, L, Wu, C, Sun, L, Lin, Q, et al., Densification effects on the fracture in fused silica under Vickers indentation, Ceram. Int. 48, 9330 (2022). https://doi.org/10.1016/j.ceramint.2021.12.128. [Google Scholar]
- Tomić, Z, Jukić, K, Jarak, T, Fabijanić, TA, Tonković, Z, Phase-field modeling of fused silica cone-crack Vickers indentation, Nanomaterials (Basel) 12 (2022). https://doi.org/10.3390/nano12142356. [Google Scholar]
- Michel, MD, Serbena, FC, Lepienski, CM, Effect of temperature on hardness and indentation cracking of fused silica, J. Non-Cryst. Solids 352, 3550 (2006). https://doi.org/10.1016/j.jnoncrysol.2006.02.113. [Google Scholar]
- Suratwala, TI, Wong, L, Miller, PE, Feit, MD, Menapace, JA, Steele, R, et al., Sub-surface mechanical damage distributions during grinding of fused silica, J. Non-Cryst. Solids 352, 5601–5617 (2006). https://doi.org/10.1016/j.jnoncrysol.2006.09.012. [Google Scholar]
- Wong, L, Suratwala, T, Feit, MD, Miller, PE, Steele, R, The effect of HF/NH4F etching on the morphology of surface fractures on fused silica, J. Non-Cryst. Solids 355, 797 (2009). https://doi.org/10.1016/j.jnoncrysol.2009.01.037. [NASA ADS] [CrossRef] [Google Scholar]
- Konstantinova, TG, Andronic, MM, Baklykov, DA, Stukalova, VE, Ezenkova, DA, Zikiy, EV, et al., Deep multilevel wet etching of fused silica glass microstructures in BOE solution, Sci. Rep. 13, 5228 (2023). https://doi.org/10.1038/s41598-023-32503-w. [Google Scholar]
- Enni, K, Sreelakshmy, K, Lal R, M, Comparative study on the effects of dry and wet etching on surface characteristics of fused silica optics, Opt. Mater. 162, 116809 (2025). https://doi.org/10.1016/j.optmat.2025.116809. [Google Scholar]
All Tables
Measured diagonal length and calculated penetration depth of Vickers indentations.
SSD depths of Vickers indentations (HV0.5 and HV0.6) measured by OCT considering the PJE removal depth at various processing steps.
All Figures
|
Figure 1 (A) Plasma jet etching of fused silica sample prepared with 19 × 10 indentations using different indentation forces (HV0.5 and HV0.6). The indentation positions are further classified according to the Ry-Cx scheme. The orientation of the PJE wedge relative to the indentation matrix is depicted by the purple gradient. (B) Etch profiles along the wedge in y-direction with corresponding row positions of the indentation after eight subsequent PJE steps. |
| In the text | |
|
Figure 2 Digital microscope image of Vickers indentation (A) R2-C4 (HV0.5) and (B) R19-C7 (HV0.6) in the initial state. |
| In the text | |
|
Figure 3 Evolution of R2-C4 indentation (HV0.5): microscopic dark field images (grey scale) and WLI measurements (false color) are compared for selected PJE steps with etching depths of d. (A) Indentation prior to PJE and (B)–(D) after PJE steps #5 and #6. |
| In the text | |
|
Figure 4 3D representations of OCT measurements of the R2-C4 indentation (HV0.5): (A) initial state, (B) after PJE step #3, and (C) after PJE step #5. |
| In the text | |
|
Figure 5 Evolution of R19-C7 indentation (HV0.6): microscopic dark field images are shown for selected PJE process steps with etching depths of d. (A) Indentation prior to PJE. (B)–(D) Indentation after PJE steps #2, #3, and #6. |
| In the text | |
|
Figure 6 SSD depth of Vickers indentations for different process states measured by OCT considering the PJE removal depth (n indicates the number of measurements for each column). |
| In the text | |
|
Figure 7 Color-coded depth maps of the subsurface damage determined by OCT-measurements for Vickers indentation R2-C4 (HV0.5): (A) initial state, (B) after PJE step #3, and (C) after PJE step #5. |
| In the text | |
|
Figure 8 Determination of SSD depth after PJE: (A) Etch dependency of void volume and slope determination for three indentations. (B) Etching depth and Sv of the maximum slope position. |
| In the text | |
|
Figure 9 SSD depth measured with OCT in comparison to SSD depth determination based on surface roughness Sv value and applying equation (5). (n indicates the number of measurements each column). |
| In the text | |
Current usage metrics show cumulative count of Article Views (full-text article views including HTML views, PDF and ePub downloads, according to the available data) and Abstracts Views on Vision4Press platform.
Data correspond to usage on the plateform after 2015. The current usage metrics is available 48-96 hours after online publication and is updated daily on week days.
Initial download of the metrics may take a while.