Figure 11
Download original image
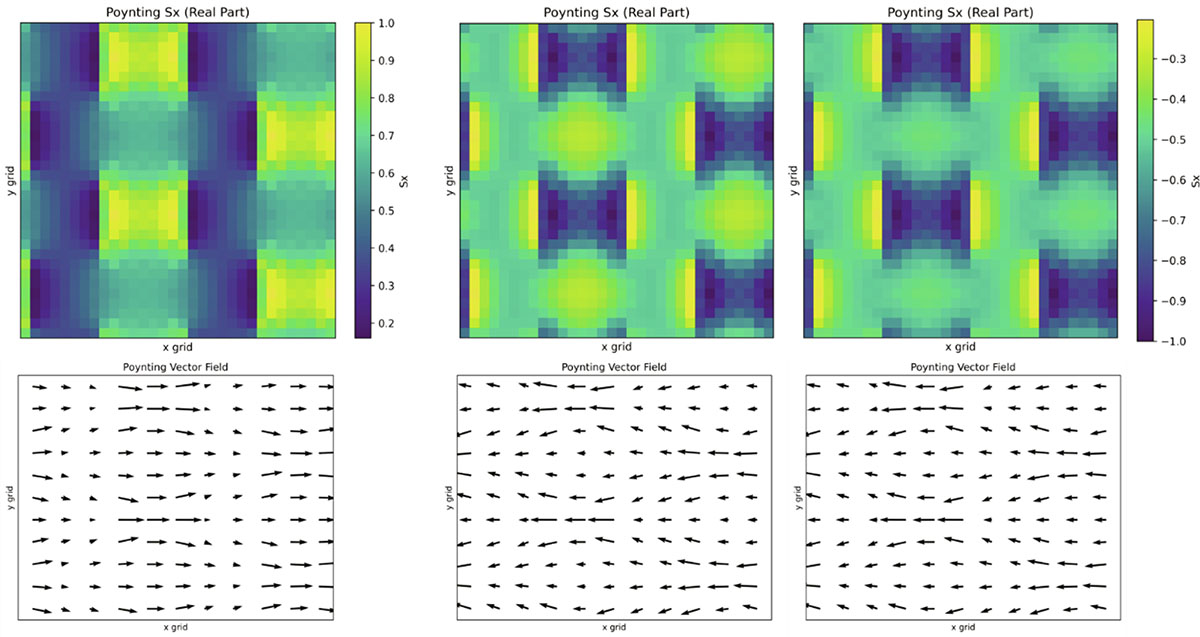
Spatial distribution of the real part of the Poynting vector (top row) and the corresponding in-plane Poynting vector field (bottom row) for the optimized 4 × 4 symmetric geometry. The colormap illustrates the magnitude and sign of the power flow, while the arrow plots indicate the local energy propagation direction across the unit cell. The results highlight the symmetry-induced field distribution and energy transport characteristics of the structure. (k Γ-M = 125 × 10−3, band: 1; k Γ-M = 5.00 × 10⁻³, band:3; k Γ-M = 125 × 10−3, band: 3.
Current usage metrics show cumulative count of Article Views (full-text article views including HTML views, PDF and ePub downloads, according to the available data) and Abstracts Views on Vision4Press platform.
Data correspond to usage on the plateform after 2015. The current usage metrics is available 48-96 hours after online publication and is updated daily on week days.
Initial download of the metrics may take a while.