| Issue |
J. Eur. Opt. Society-Rapid Publ.
Volume 22, Number 1, 2026
EOSAM 2025
|
|
|---|---|---|
| Article Number | 40 | |
| Number of page(s) | 12 | |
| DOI | https://doi.org/10.1051/jeos/2026019 | |
| Published online | 19 May 2026 | |
Research Article
Eye-safe non-line-of-sight localization using compact nanosecond laser diodes and single-photon-avalanche-diode arrays
1
Fraunhofer Institute for Microelectronic Circuits and Systems, 47057 Duisburg, Germany
2
University of Duisburg-Essen, 47057 Duisburg, Germany
* Corresponding author: This email address is being protected from spambots. You need JavaScript enabled to view it.
Received:
26
November
2025
Accepted:
24
February
2026
Abstract
Active optical non-line-of-sight (NLOS) imaging faces severe photon loss and stringent timing demand, often motivating bulky, non-eye-safe systems with femto- or picosecond lasers and spatial scanning schemes. We present an eye-safe, compact NLOS localization approach that uses a single-photon-avalanche-diode array with on-chip timing and inexpensive and compact nanosecond pulsed laser diodes. To circumvent first-photon induced saturation in soft-gated detectors, the scene is illuminated from two positions placed outside the detector’s field of view. The detector observes the relay wall in parallel, yielding a photon-efficient, non-confocal measurement. Transient simulation of multiple scattered laser pulses, that returned to the relay wall after an object interaction, are used with back projection reconstruction to assess illumination schemes. It is shown that superimposing reconstructions from two non-central illumination positions reduces the pulse-width-induced uncertainty of the determined target position, which is validated by measurements. Further compensation of the extended pulse width is analyzed with temporal and spatial filters. Matched filtering in the temporal domain outperforms spatial edge detection in the reconstruction volume, so that localization resolution becomes primarily limited by the detector’s temporal resolution and measurement geometries rather than temporal pulse width. We outline a hybrid LiDAR-NLOS system for direct relay-wall calibration, pointing toward practical, eye-safe NLOS localization, with compact solid-state hardware.
Key words: Non-line-of-sight / Eye-safe / Localization / Single-photon-avalanche-diode
© The Author(s), published by EDP Sciences, 2026
 This is an Open Access article distributed under the terms of the Creative Commons Attribution License (https://creativecommons.org/licenses/by/4.0), which permits unrestricted use, distribution, and reproduction in any medium, provided the original work is properly cited.
1 Introduction
Most environmental sensing systems, i.e. radar, light detection and ranging (LiDAR), ultrasonic sensors or conventional cameras are designed to observe a scene in direct line of sight. The measured area or volume of interest varies substantially, spanning from single-point intensity measurements to spatially resolved, three-dimensional information. When the observing systems cannot be positioned to view the scene of interest directly, systems based on non-line-of-sight (NLOS) approaches might be used. Potential applications for such approaches include collision avoidance in automotive and robotic contexts, locating people behind doors or rubble for public safety and rescue, and industrial inspection of occluded defects. Although NLOS systems can employ various remote sensing modalities [1–4], time-correlated photon-based approaches have been the main focus of research to date [5–10]. They exploit diffuse reflections from everyday surfaces and afford discrete illumination positions and high temporal resolution, which are crucial for high-resolution reconstruction of hidden scenes [9].
Active optical NLOS imaging refers to measuring multiple scattered laser pulses to extract information about scene elements that are not directly visible to the observer. The system typically comprises a collimated pulsed laser and a detector with high temporal resolution, which together illuminate and observe multiple positions on a relay wall positioned in the direct line of sight. The pulse scatters off the relay wall into the NLOS scene, where it undergoes secondary scattering from objects hidden in the scene and the rebounds back to the relay wall, where it can be observed directly by an optical detector (see Fig. 1a). The resulting multiply scattered transients on the relay wall are measured with spatial and temporal resolution. Such optical NLOS systems are differentiated by the arrangement of illumination and detection points. Confocal arrangements [8, 10–12] scan the relay wall and measure transients only at the current illumination point, ignoring most returning reflections and thus being inherently photon-inefficient. In contrast, non-confocal arrangements, with arbitrary numbers and positions of illumination and detection points, can be designed in a more photon-efficient manner.
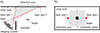 |
Figure 1 a) Top-view schematic of the NLOS setup. b) Front-view of the relay wall. The black square represents the projected target position. |
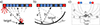 |
Figure 2 a) NLOS measurement process with two Lambertian scatterings indicated with red arrows. Dashed arrows indicate pulse propagation. b) Resulting ellipses of possible target reflections that could have produced the measured data of detection positions 4 and N (blue circles) from illumination position 1 (red circle). The intersection indicates the actual target position. c) Overlapping ellipses for finite pulse width of a centrally positioned target. Ellipses I and II originate from laser position 1 (red circle) and detection position 1 and N respectively. Ellipse III originates from laser position 2 and detection position N, confining the light grey area to the dark grey area. |
Both confocal and non-confocal arrangements share fundamental hardware components comparable to those of direct time-of-flight (ToF) LiDAR systems used for three-dimensional imaging in the direct field of view (FoV). However, in NLOS systems the laser pulse paths are more complex than those encountered when measuring distances in direct line of sight. First, at least three reflections before detection drastically reduce the receivable photon flux compared with single reflection in direct ToF LiDAR. Second, the achievable lateral resolution of reconstructed NLOS scenes cannot be controlled solely via detector pixel resolution or the number of illumination points, as in LiDAR. Instead, not the number of pixels but the temporal resolution combined with the spatial extend of the illumination and detection scheme on the relay wall define the achievable depth and lateral resolution. These requirements place heavy demands on the measurement setup. Existing lab-grade systems are often expensive and far from compact, relying on pico- and femtosecond laser sources, single-photon-sensitive detectors, and complex time-correlated singe-photon counting electronics. Moreover, free-space propagation loss scales with the inverse fourth power of the object distance to the relay wall [7], compared with the inverse-square loss in LiDAR. This is often compensated by higher laser power, which comprises eye-safety and limits applicability to laboratory environments.
In this work, an eye-safe NLOS localization system is presented that addresses the constraint of restricted laser emission through a high-efficiency photon-detection design and achieves inexpensive, compact implementation using nanosecond-pulsed laser diodes. Specifically, a two-dimensional single-photon-avalanche-diode (SPAD) array with integrated timing capabilities and camera optics is developed and used to observe, in parallel, the detection region on the relay wall. A single illumination point combined with the dense grid of detection points meets the requirements for a NLOS measurement. Scan-free NLOS imaging [13, 14] has been reported previously with this single illumination system design using picosecond pulsed laser sources. Extending this prior work, we examine the performance gains for localization using additional illumination position. Simulated time-of-arrival photon statistics, validated by measurements with the implemented system, are used for the investigation. Despite the longer pulse width compared to comparable NLOS systems, three-dimensional localization of a target in a NLOS scenario is achieved at a resolution determined solely by detector parameters.
2 Material and methods
2.1 Measurement setup
The measurement setup comprises two pulsed laser diodes and a time-resolved multi-pixel detector [15] with camera optics that image the relay wall. Each diode operates at the accessible emission limit specified for eye-safe operation, meaning that neither the repetition rate nor the pulse energy can be increased without reducing the other in order to increase the system’s performance without losing civilian applicability. Nevertheless, the spatial separation and individual emission angles allow the use of more than one diode in the system, as only one laser can be imaged onto a hypothetical retina at a time. Therefore, spatially separated sources are used to comply with laser safety standards, even though the total emission into the scene is multiplied. The dual illumination scheme corresponds to the simplest case of multiple illumination and provides two symmetry planes for the following analysis. Although more sources could be implemented, illuminating arbitrary positions using a mirror system with a single laser source for instance, circumvents the exploitation of multiplied total emission. Depending on the reflecting angles of the mirror, a nearby retina could receive the laser power from multiple emission angles. Moreover, the laser diodes used are cost-efficient and solid-state-based compared to galvo mirror designs.
The arrangement is a common NLOS imaging scenario with a flat relay wall, an occluder, an observing system, and an NLOS scene containing a single target placed in 1.5 m distance to the relay wall (Fig. 1a).
The SPAD-array detector [15] has 24 × 32 pixels with individual time-to-digital converters (TDCs) that generate ToF histograms under a first-photon detection scheme. With each laser pulse, each pixel yields at most one timestamp. This time of arrival corresponds to the first induced avalanche in the SPAD within one measurement cycle of 1/f rep = 80 μs duration, where f rep denotes the laser pulse repetition frequency of 12.5 kHz. Because signal photons, ambient light, and dark counts can all trigger these avalanches, histogramming of the time stamps is required to gather sufficient statistical information and recover the required transients for NLOS reconstruction. The pixel-specific bin widths of these histograms are approximately 400 ps, as given by the integrated TDC circuits. The detector has a microlens-enhanced fill factor of 26.8% and a quantum efficiency of 2% at 905 nm [16]. The FoV covers a 2 m × 2 m. rectangular region on the relay wall. The soft-gated detector precludes direct illumination within the FoV because the direct reflection of the laser pulse would saturate the detector. To mitigate the resulting illumination inhomogeneity, two illumination points are placed at opposite edges of the FoV, as shown in Figure 1b.
The laser sources are pulsed laser diodes operating at 905 nm, this mitigating eye-safety conditions and optical pollution due to their non-visibility to the human eye. They generate pulses with 2.4 ns temporal width (full width at half maximum) and a nearly top-hat temporal beam profile. Each diode generates 30 W peak optical, resulting in an average power below 1 mW at the repetition rate of 12.5 kHz. Their pulse-on-demand capabilities are used to emit laser pulses synchronized with the detector. Because each pulse emission can only generate one timestamp per pixel, the measurement statistics scale with the number of emitted pulses. Given the fixed repetition rate, the achievable frame rate is inversely proportional to the number of pulses per acquisition. The alternating emission of the laser sources is necessary to assign the measured timestamps to an illumination position, which is essential for valid reconstruction. With a doubled detector frame rate, the two alternating 12.5 kHz emissions can be captured, resulting in the same measurement frame rate for the single and dual illumination scheme.
2.2 Simulation and calibration
For a controlled, calibration-independent assessment of system performance, simulated measurements are used in addition to proof-of-concept measurements with the physical setup. However, certain experimental conditions, such as specific pulse lengths and a central illumination scheme, cannot be achieved with the physical setup that has been developed. Spatially and temporally resolved transients of scattering light at the relay wall are therefore simulated while incorporating first-photon detector behavior. Because a photon can be detected only if the SPAD has not already fired, the first-detection probability decays exponentially with time at a rate set by the background light level rB. Impinging photon rates rL of the three-bounce laser pulses are calculated using view factors, which yield the fractions of Lambertian scattering into a specified solid angle. These rates and their corresponding ToF define the photon detection probability density function (PDF) of each detector pixel: (1)
(1)
Here, tP is the temporal width of a rectangular laser pulse and tToF is the time of flight determined by the distances between the illumination position, target position and the imaged pixel position on the relay wall. Synthetic histograms are generated using the inverse transfer method by sampling arrival times from the PDF (1). Subtracting the exponentially decaying background component induced by a constant background rate rB mitigates intensity gradients in the reconstruction.
The simulation assumes only Lambertian surfaces. Specular and retroreflective targets would naturally lead to alternative distributions of the receivable light, as described in Section 3.1. Nevertheless, the extensive area of detection increases the probability of receiving specular components of the target reflections, especially given the changing angle of incidence of the target illumination due to the dual illumination scheme. Retroreflective targets, which are best detected by confocal measurements, can also be detected, because the illumination positions are placed close to the edge of the detection area.
While the simulation covers the entire light transfer function from laser emission to detection via triple reflection, the original data of the measurement setup must be further calibrated in order to extract the relevant parts of the transient histograms. The line-of-sight (LOS) propagation of the laser pulse from the system to the relay wall and the LOS observation of the relay wall must be subtracted to obtain the light transmission relevant for NLOS reconstruction. Theoretically, the propagation times between the detector and the detection point on the relay wall could be extracted from a LiDAR measurement of the relay wall. To rule out errors from such additional measurements, the spatial alignment between the system and the relay wall is measured manually. For this purpose, the intensity-based photon-counting mode of the system is used to map the relay wall equipped with retroreflector landmarks. The virtual start time of the pulse propagation originating from the relay wall is calibrated using the high-intensity peak of the primary reflection of the laser pulse on the relay wall within the measured histograms. The pixel-dependent propagation times between the detection point on the relay wall and actual detection at the system are compensated using the geometrical model of the measurement setup, yielding the required light transfer function between relay wall and target for the reconstruction procedure. Pixel-dependent temporal bin widths and periodic bin width variations are compensated prior to reconstruction using individual TDC calibration data provided by the system. This interpolates all measured histograms to a uniform temporal grid with 400 ps steps.
Multipath clutter of light paths with more than three bounces are ignored, as signal intensities decrease drastically with each diffusive reflection. Nevertheless, vertical walls adjacent to the relay wall have a significant impact on the transient data, requiring subtraction of an otherwise empty scene to extract the target positions as described below. The simulations therefore omit additional walls, but the physical measurement includes a parallel surface (the floor) at a distance of 3 m from the relay wall. Its additional NLOS contribution within the transient data is subtracted but requires increased measurement statistics to detect targets near this interfering wall, as the signal strength of such large surfaces exceeds the target signal.
2.3 Reconstruction and filters
For the reconstruction of the NLOS scene based on the transient data, that corresponds to individual ToF per target position and detection position, several methods have been reported. Individual requirements on illumination and detection positions, being uniformly distributed [17] or in confocal arrangements [8, 18], prevents their applicability to the non-confocal system under study without error inducing transformation of the measurement data [19]. In contrast, the filtered back-projection (FBP) [20–23] used here is an ellipsoid-based reconstruction method that can handle arbitrary measurement schemes and gives insights into pulse width induced errors directly. The formation of the transients used for the reconstruction is described by the three-bounce path of the laser pulse. The time-of-flight (ToF) of the laser pulse from its scatter on the relay wall to its return to the wall after target reflection is measured (Fig. 2). This ToF is proportional to the sum of the two paths a and b indicated in Figure 2a. Possible target positions that could have produced the measured ToF are all located on an ellipsoid, or on an ellipse in two dimensions, that satisfies a + b = a′ + b′. The foci of these ellipsoids are the illumination position and the corresponding detection point on the relay wall. By introducing multiple detection points or illumination points, the intersection of the superimposed ellipsoids indicates the target position (Fig. 2b).
For a resolution estimation of the non-confocal setup under study, the signal contribution of finite pulse widths within back projection reconstruction is examined. In Figure 2c, three relevant ellipses are shown with an effective width of approximately half the pulse width times the speed of light. The target is centered at pT. The central ellipse II describes the signal contribution of a laser position and the detection point at the opposite border of the detection area, for example illumination position 1 and detection point N. Because this arrangement is symmetric, both laser position yield the same ellipsoid. The ellipse I results from laser position 1 and its nearest detection point 1 and is approximated by a circle around the laser position. The possible ellipses of all other pairs of laser position 1 and the remaining detection points are not shown but they all contribute to the regime hatched in grey, which is defined by the overlap of these two specific ellipsoids. The circle III belonging to illumination position 2 defines the dark grey region where all ellipsoids of the laser position 1 and 2 contribute. The lateral width lsingle (5) is halved (6) by restricting the feasible target area from illumination position 1 through superposition with the reconstruction from illumination position 2. This is observed by the lateral distance of the intersections at points p1 (2) and p2 (3) for a target at position pT compared with the boundary p3 (4) of the more confined area (dark grey, Fig. 2c). (2)
(2)
 (3)
(3)
 (4)
(4)
 (5)
(5)
 (6)
(6)
Here, c denotes the speed of light. These expressions follow from a geometrical model with ellipse foci at ±w, which correspond to the illumination offset to the scene center. The semi-major axis α of the ellipse corresponding to II in Figure 2c and the radius r of the intersecting circle (7) centered at the focus point are defined by the target ToF for the rising edges (9) with additional dependence on the pulse width for the falling edge (10). The lateral intersection position of two circles at p3 (4) with a spacing of 2w are given in (8) used for calculation of p3. (7)
(7)
 (8)
(8)
 (9)
(9)
 (10)
(10)
According to the geometric model, the lateral spread of feasible target positions is expected to be halved along the axis defined by the illumination points. The resulting reduction in three-dimensional localization error due to this superposition is examined in the Results section.
The filtering applied to the reconstruction result and the underlying temporal domain data discussed is not intended to enable general imaging capabilities but to compensate the effects caused by the finite temporal laser pulse width, which is several times larger than the detector’s temporal resolution. The extracted target position from the reconstruction result corresponds to the maximum-valued voxel in the reconstruction volume. To use this position extraction, only a single target may be simulated or measured at a time to avoid multiple local maxima. Moreover, partial occlusion by additional targets and phantom targets resulting from signal overlap of individual targets would complicate the extraction of target positions. Partial occlusion of the relay wall by the target is also omitted, so that all points of detection are accessible to the system and the reconstruction scenario discussed above remains valid. A Laplacian-of-Gaussian (LoG) filter which is typical for FBP [21, 24] can optionally be applied to the reconstruction, with the Gaussian width matched to the voxel size to detect the rising edge of the broad overlapping ellipsoids. The temporal data can optionally be filtered before reconstruction with a Gaussian filter with a sigma matched to the pulse width. A matched filter with an appropriate temporal shift can also be applied to concentrate the received pulse form on the rising edge of the original signal to mimic a discrete ToF besides the finite pulse width.
3 Results and discussion
3.1 Illumination schemes
A central illumination position within the detection area on the relay wall may seem obvious in terms of scene illumination but strongly reduces the sensitivity for multiply scattered NLOS signals due to detector saturation by direct scattering in the employed first photon detection scheme. Hence, illumination positions outside the detection area are examined. Possible illumination positions are placed on an exemplary axis across the center of the detection area as shown in Figure 1b along which a target will be placed with an offset to the relay wall. A plane of interest is defined that is perpendicular to the relay wall and intersects with the aforementioned illumination axis. Within this plane, the distribution of receivable signal is computed using view factors that describe the radiation from a surface into a specific solid angle. The receivable signal quantifies the photon flux that reaches the detection area on the relay wall given by the photons that impinge on the target. The latter depends on both the illumination and the target position. Since the receivable signal from a target is directly linked to the signal-to-noise ratio (SNR) of a NLOS measurement it is a figure of merit for achievable reconstruction performance.
For a non-central illumination located at the left edge of the detection area the distribution of receivable signal is highly inhomogeneous across the scene as shown in Figure 3a. An additional illumination position shown in Figure 3b is used to compensate for the disadvantaged right side of the scene. At the cost of an additional laser source and alternating measurements of each illumination position with doubled detection rate, the photon flux into the NLOS scene can be doubled while complying with eye safety restrictions. All illumination schemes (Figs. 3a–3c) show that the receivable signal is maximized for target positions in front of the illumination positions. For larger target distances from the relay wall, the receivable signal decreases due to free-space propagation losses. Non-central targets benefit from non-central illumination, as indicated by higher values at lateral target positions for the dual illumination scheme compared to the central scheme where the receivable light decreases visibly towards the side edges (cf. Figs. 3b, 3c). Conversely, the advantage of central illumination (Fig. 3c) for central target positions is confined to the near field of the relay wall, mostly covered by the direct line-of-sight and thus of little relevance for the NLOS discussion. Fig. 3d) shows the regions where central illumination outperforms dual illumination, presenting the ratio of receivable light. At all positions colored white, the receivable light under dual illumination equals or surpasses that of the central scheme with single illumination. Consequently, non-central illumination can be used to illuminate the NLOS scene with minimal loss of receivable light, preventing detector saturation due to directly scattered laser light.
 |
Figure 3 Receivable signal on the detection area per target position a) for one illumination position to the left of the detection area, b) for two illumination positions around the detection area, c) for a central illumination. d) Target positions where the central illumination yields more signal than the dual illumination scheme. |
While the receivable signal is only an indicator for the relative localization performance across the NLOS scene, simulated transients are used to further assess the non-confocal reconstruction method. This provides a qualitative insight into the reconstruction performance under the dual-illumination scheme. A NLOS scene with a single target at a distance of 1.5 m from the relay wall is considered. The target is either centered within the detection area, and thus symmetric with respect to both illumination positions, or laterally displaced toward illumination position 2, as depicted in Figure 4a. The aforementioned plane of interest of the three-dimensional back-projection result is shown in Figures 4b and 4c for a centered target and each illumination position. In Figure 4b, with the relay wall at the top and a single laser positions, the overlapping ellipsoids produce a spatially extended high-intensity region that indicates the target position. Because of the finite pulse width, this intersection of ellipsoids does not reduce to a single point. Moreover, due to limited statistics and added noise in the simulated transients, the overlap is even more extended than predicted by the geometric approximation introduced earlier. The alternative illumination position in Figure 4c yields the same result, except for a horizontal mirror due to the shift of the fixed focus point to the new illumination position. The sum of these reconstructions (Fig. 4d) produces a more confined, higher-contrast region at the target position. For a single illumination position, all ellipsoids share one focus and are therefore similar, whereas the tangents of the ellipsoids at the target position differ more strongly for individual illumination positions. For targets off the symmetry axis, this geometric confinement by superposed reconstructions persists, but the resulting high-intensity region is less pronounced (Fig. 4e). This reduced confinement is attributed to unequal ellipsoid intensities in each reconstruction caused by different distances to the illumination position. Under the same simulated-measurement parameters of the transient simulation, but for a lateral target displacement of 0.5 m toward illumination position 2, the ellipsoids of illumination point 1 are barely visible. The visualized reconstruction results indicate, that the dual-illumination provides geometric benefits beyond more uniform scene illumination.
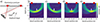 |
Figure 4 a) Top-view schematic of the NLOS setup with indicated target and illumination positions. b–d) 2D slices of the simulated unfiltered ellipsoid based reconstruction volume for laser position 1 and 2 and for the superposition of both, e) for a target off the symmetry axis by 0.5 m to the right. White arrows indicate the target position. |
A root-mean-squared-error (RMSE) analysis is performed to quantitively assess localization errors and the confinement gain by superimposed reconstructions from individual illumination positions. The confined high-intensity region corresponds to feasible target positions, which are extracted from the unfiltered reconstruction result by maximum detection. Despite the two-dimensional depiction in Figure 4, the simulation covers a three-dimensional volume, so that the RMSE refers to the three-dimensional offset between the extracted target position and the ground truth.
For a central target at a distance of 1.5 m from the relay wall, the localization error decreases with an increasing number of measurements per laser position, as expected (Fig. 5a). A localization error of more than one meter for the lowest count of 125 simulated measurements per reconstruction is not considered a successful localization. Nevertheless, the residual RMSE for the largest statistic considered reflects the uncertainty in the feasible target area induced by the pulse width and is therefore consistent with a valid localization within the constraints given by the assumed system parameters. As indicated in Figure 4, superposition of the two reconstructions reduces the localization error compared with using only one illumination position. This enhancement cannot be explained simply by the increased number of receivable signal photons by the additional measurement, which would only follow the general trend of decreased errors with increased statistics. This is evident because the superposed result at 1,250 measurements outperforms single illumination results that use 10× more measurements, see Figure 5a. The central illumination scheme yields the maximum receivable signal among single illumination positions, yet it is still outperformed by the superposed reconstruction for practical measurement counts.
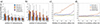 |
Figure 5 a) Simulated illumination dependent localization errors per number of measurements on the symmetry plane, b) near laser position 1. c) Localization errors for lateral target displacement at 1,250 measurements, and d) at 50,000 measurements. |
For other target positions the benefit of superimposed reconstructions varies and can even degrade localization performance. For example, a target at the same relay wall distance but outside the uniformly illuminated center is best localized using only the nearest laser position when the number of measurements is small, see Figure 5b. This lack of improvement from superposition is caused by the imbalance in signal to noise ratio (SNR) between the two reconstructions, as visualized in Figure 4e. For large numbers of measurements and resulting higher SNR the confined target region is again reduced geometrically by superposition, compare Figure 2c. The lower localization error for the nearest illumination compared with central illumination is due to the higher receivable signal caused by minimized free-space propagation losses.
Figure 5c shows how the localization error evolves with lateral target displacement from the centered position and reveals the performance difference between central illumination and off-center illumination. A centered target benefits from central illumination, while a target displacement reduces the receivable signal in two ways. First, a longer free space path and the angular dependence of Lambertian illumination by the laser spot reduces the signal reaching the target. Second, the view factor from the target to the detection area decreases at non-central positions. For a centered target, illumination by a non-central laser position is comparable to central illumination except for the slight reduction in signal reaching the target. With lateral target displacement, this loss decreases for the approached laser position and increases for the other position. The increased signal at the target for the closer laser position counteracts the reduced view factor towards the detection area, which results in a more stable localization error across the scene. This is indicated by the nearly constant RMSE for illumination position 1 (blue curve, Fig. 5c). Note that although the distant laser position 2 does not provide reliable localization, superposition is nevertheless advantageous for limited displacements (yellow curve, Fig. 5c). The general geometric confinement benefit of superposition is valid for high measurement counts as illustrated in Figure 5d since it resembles the model of Figure 2c. However, the reduction of the localization error for low statistics is more important regarding the overall systems performance.
Summarizing, the multi-spot illumination scheme improves the localization system not only through spatially more balanced scene illumination but also through geometrical confinement of the feasible target region, even when individual illumination positions show limited standalone performance. While the confinement gain was analyzed with two illumination positions for an exemplary axis, the use of four positions at the middle of each edge of the rectangular field of view naturally leads to confinement along two orthogonal axes. Further confinement could be achieved with more illumination points, although a finite number of illuminations is desirable due to limited detector frame rates and the requirement that only one illumination position can be used in every measurement cycle.
3.2 Measurement validation
The localization benefit of superposed reconstructions is validated with measurement data shown in Figure 6. The designed measurement system is compact and eye-safe. It uses a SPAD-array detector with integrated timing and two laser diodes with nanosecond pulses as sketched in the Measurement Setup section. The system is placed on the floor of a room with a height of 3 m imaging the flat ceiling at an angle of 15° in order to localize a target that is not directly visible to the system. An occluding wall that prevents direct imaging of the target (Fig. 1a) would potentially contribute an additional NLOS signal, so it is omitted. A 20 × 20 cm2 flat target positioned in parallel to the ceiling is used, in contrast to the point-like scatterer assumed in the simulations. Consequently, not only the pulse width but also its spatial extend influences the localization error by introducing multiple ToF per target and detection point. The target is placed near the center of the scene at a distance of 1.5 m from the relay wall (ceiling).
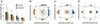 |
Figure 6 a) Measured localization errors for different measurement statistics. b–d) Extracted lateral target positions of 100 repetitions with 1,250 (b), 5,000 (c) and 50,000 (d) measurements per reconstruction. Histograms show the distribution of extracted target positions for a single illumination (top and right, blue histograms) and superposed reconstructions (bottom and left, yellow histograms) of each lateral axis. The black cross indicates the actual target position. |
As predicted by the simulations, the localization error decreases as the number of measurements increases (Fig. 6a). When the number of measurements rises from 1,250 to 5,000, reducing the possible repetition rate of a measurement from 10 frames per second (fps) to 4 fps, the localization error decreases from 1 m to 0.74 m and 0.68 m for laser positions 1 and 2, respectively. With more measurements, the localization error for laser position 2 decreases stronger than for position 1; at 12,500 measurements (1 fps), the error is 0.32 m for position 1 and 0.26 m for position 2. This difference is attributed to imperfect Lambertian reflection at the primary reflection of the laser pulse on the ceiling. While the specular component for laser position 1 can geometrically contribute to the target illumination, the direct reflection from position 2 is directed away from the NLOS scene, to the right in Figure 1a. At 50,000 measurements, which corresponds to four seconds of measurement time, the localization error and the standard deviation of the extracted target locations fall even below the values predicted by the simulations. Independent of the individual laser positions, the combination of both illumination points shows the smallest error for all measurement statistics. Therefore, the simulations and the experimental measurements agree concerning the performance of the illumination concept proposed in this work: to achieve a small error in NLOS localization measurements, it is necessary to use more than one illumination points. This is especially important for low measurement statistics or fast measurements, but even at high statistics, using two illumination points can further reduce the localization error.
Nevertheless, there are discrepancies between the simulation and the measurement concerning the generation of the feasible target region that is assessed by the localization error. In contrast to a single-valued plateau approached with increasing measurement statistic for the simulation, the physical setup causes a global maximum to be formed within the laser pulse width induced feasible target region. On the one hand, the spatial extent of the physical target generates confined phantom objects through the overlap of signals from different reflection points on the target. On the other hand, system dependent factors lead to a global maximum of intersections in the reconstruction, which supports convergent localization. The imperfect top hat laser profile affects the signal distribution along the width of the ellipsoid and prevents the formation of an equal valued volume behind the actual target position as discussed above. Furthermore, pixel specific dark count rates and sensitivities influence the signal contribution of each ellipsoid orientation depending on the detection position relative to the illumination position. This artificially confines the overlapping signal volume by favoring reconstruction voxels along individual ellipsoids.
Since the distance from the relay wall of the target position is measured with little error even for low measurement statistics, a two-dimensional map of extracted lateral target positions is used to illustrate the three-dimensional localization in Figures 6b–6d. For each measurement statistic, the target position is measured 100 times and its extracted position is plotted. This naturally results in multiple occupancy of the discrete reconstruction voxel space. To better illustrate convergent localization, the distribution of determined target positions is also indicated by histograms along both lateral axes. Opposite histograms represent the results of superposition (yellow dots) and laser position 1 (blue dots) respectively and are equally scaled. In agreement with the simulations, the reduced localization error is mainly observed along the illumination axis defined by the line connecting the separated illumination points. This can be observed by the narrower distribution in the horizontal histograms compared with the vertical histograms of the super positioned results (yellow).
The compact measurement setup locates a NLOS target successfully under eye-safe conditions and validates the simulated benefits of superposed reconstructions of individual illumination points. The deviation from the homogenous feasible target region predicted by the simulation, resembles the formation of a global maximum in the actual measurement result. Although this effectively decreases the standard deviation of extracted positions, it results in a systematic error depending on the pulse form and target position. This indicates the need for filtering to achieve localization that is independent of pulse width.
3.3 Spatial and temporal filtering
Our demonstrated eye-safe NLOS localization exhibits an extended feasible target region that leads to localization errors larger than the temporal detector resolution and the finite reconstruction grid presets, caused mainly by the temporal laser pulse width. The achievable localization performance, limited by the laser pulse width and measurement statistics, has been addressed through scene illumination schemes and their superposition. To directly address the extended pulse width, associated with the compact laser diodes, filtering of the reconstruction result and the temporal domain data is examined. Filtering of the reconstruction is commonly used in ellipsoid based back-projection methods to increase the visibility of features in complex scenes in NLOS FBP imaging. There, the edge sensitive filters are applied to the reconstruction volume to compensate for uncorrelated ellipsoids from other parts of the scene that overlap with the target signal of interest. Although no other target is present in the localization scenario discussed here, edge filtering of the reconstruction result can still be used to compensate for noise and the pulse width induced extension of the target signal. By design, only the rising-edge of the pulse that interacts with the NLOS scene corresponds to the actual ToF of the three-bounce scattering path. Therefore, filtering in the temporal domain of the measured transients is also investigated that preserves the rising-edge information.
To determine the influence of different filters on the localization result and error, further simulations were carried out. The simulations are based on a data set of 100 repetitions per measurement statistic and filter combination. The filter combination consists of filters used on the temporal domain data and spatial filtering of the reconstruction volume. The temporal filters are given by a Gaussian filter aiming for denoising and a matched filter for promoting the rising-edge of the received pulse from. The spatial filter is a Laplacian of Gaussian (LoG) edge sensitive filter to promote the edge of the ellipsoid intersection at the target position. The analysis of the resulting localization error after filtering is performed for different number of measurements per reconstruction (Fig. 7a), ranging from 1,250 to 125,000 measurements. Error bars denote the standard deviation of the determined target position and allow the distinction between systematic localization errors and the variation of extracted positions. Figures 7b and 7c visualize the extracted target positions for a statistic of 12,500 measurements per reconstruction, corresponding to 1 fps of data acquisition. For better visibility, the relay wall and thus the illumination positions are located at the bottom of each point cloud representation. Figure 7b corresponds to reconstruction with temporal filtering only, and Figure 7c shows results with additional LoG filtering of the reconstruction volume prior to the target position extraction.
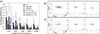 |
Figure 7 a) Simulated localization errors for filter combinations of no temporal filtering, Gaussian filtering and matched filtering with an optional spatial LoG edge detection. b) Corresponding resulting target positions per temporal filter at 12,500 measurements per reconstruction and a laser pulse width six times the detector’s temporal resolution and c) with additional LoG edge detection in the reconstruction volume. The red dots denote the nominal target position. |
Maximum detection on an unfiltered reconstruction yields the largest localization error for high statistics because the reconstruction forms an extended high signal volume behind the target position as discussed above (purple, solid outline, Fig. 7a). With Gaussian filtering in the temporal domain (green, solid outline, Fig. 7a), the standard deviation of the extracted position decreases at high statistics while the RMSE persists. This indicates the formation of a global maximum behind the actual target position at an increased distance from the relay wall (green dots, Fig. 7b). This maximum is formed because the Gaussian filter deforms the temporal top hat laser profile. Using a smaller width of the Gaussian filter can minimize this deformation and prevent a global maximum, but this resembles a transition to the unfiltered reconstruction and is therefore not pursued further. The matched filter (blue, solid outline, Fig. 7a), shows the best performance for results without spatial edge filtering. The filter is designed to generate a maximum at the target ToF in the detection point wise histograms representing the transients on the relay wall. Consequently, the overlapping ellipsoids will form a global maximum in the reconstruction as well (blue, solid outline, Fig. 7b). The position of this maximum corresponds to the actual target position, in contrast to the displaced maximum formed by Gaussian filtering. Remaining errors are due to temporal discretization and the finite voxel grid. It should be noted that the localization error still decreases more strongly along the axis defined by the illumination positions, where the geometric benefit of superposition comes into effect (y-axis in Figs. 7b and 7c).
Applying the edge filter to a reconstruction without temporal filtering yields the smallest systematic error at high statistics but performs worst at lower statistics (purple, dashed outline, Fig. 7a). For off-centered targets not shown explicitly, a position dependent systematic error is introduced due to shape sensitive edge detection of the high intensity area. With Gaussian filtering in the temporal domain beforehand, the rising edge of the pulse profile is flattened, which disadvantages precise edge detection, although the increased SNR enables coarse localization at lower statistics (green, dashed outline, Fig. 7a). For the statistics of 12,500 measurements used in Figure 7c, Gaussian filtering (green dots) promotes edge detection near the actual target position, while the temporally unfiltered reconstruction appears to perform worse (purple dots). In fact, the temporally unfiltered result has a comparable RMSE but shows larger offsets for outliers. This bare edge detection without temporal filtering (purple dots Fig. 7c) shows binary localization behavior and yields either the correct target position or an uncorrelated false position. Matched filtering combined with edge detection results in a systematic error, since the temporal filter is not designed to retain rising edges for edge detection but is included for completeness. The extracted positions are thus shifted towards the relay wall (blue dots, Fig. 7b).
The filter analysis shows, that a combination of temporal and spatial filtering can decrease the localization error best for the smallest statistics of 1,250 measurements (green, dashed outline, Fig. 7a), by denoising the rising-edge in the temporal regime and thus increasing the contrast of the feasible target region for better spatial edge detection. For higher statistics, the exclusive use of a temporal matched filter performs better, that is then outperformed by an exclusive spatial edge filter for the highest statistics. Nevertheless, the latter relies on very steep rising-edges of the pulse form, that is guaranteed for the simulation but not necessarily given by a physical setup due to temporal jitters and limited pulse form qualities.
For the determination of the best filter combination for extended pulse widths in general, the pulse-width-dependent localization performance is examined for a fixed measurement statistic of 12,500 measurements, corresponding to reasonable data acquisition of 1 fps. While shorter pulse widths generally allow for higher laser peak powers, this would increase the SNR in a way that is comparable to increasing the measurement statistics. In order to compare filter performance only, a fixed laser power is used in Figure 8 for each pulse width ranging from twice the value of the temporal detector resolution doubled to a 12-fold pulse width. The direct link between pulse width and high intensity area in the reconstruction is evident for maximum detection of the unfiltered reconstruction, represented by the increasing localization error with increasing pulse width (purple, solid outline, Fig. 8). Besides matched temporal filtering without edge detection, all filter combinations show pulse width dependent localization errors. These either originate from detecting different edges of the enlarged overlapping area or from the formation of a displaced global maximum due to the reshaped laser profile. This maximum formation causes a decreased standard deviation of the localization result and introduces a systematic offset that depends on the laser pulse width (green, solid outline, Fig. 8). The exclusive spatial edge detection in the reconstruction volume (purple, dashed outline) shows best performance for the shortest pulse width. That stands to reason, since it is comparable to the standard FBP scenario where this filtering is commonly used. There the pulse width, the temporal detector resolution and the reconstruction resolution are matched, eliminating uncertainties based on temporal pulse width. For any larger pulse widths, the spatial edge detection faces the extended feasible target region that bares the risk of detecting any part of its edge, increasing the error with increasing feasible target region.
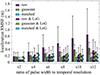 |
Figure 8 Simulated localization errors for different laser pulse widths at 12,500 measurements using different filter combinations. |
In summary, the target location using long laser pulses is best determined using edge detection as is common in FBP imaging. The condition for this is sufficient measurement statistics and a steep rising edge of the pulse form so that the reconstruction resembles the model given in Figure 2c. Nevertheless, systematic but position dependent localization errors occur due to edge detections along the pulse width induced feasibly target region. Matched filtering offers pulse width independent performance for localization of single targets in a NLOS scenarios. By incorporating all photons received in the pulse form used, this filtering is particularly suitable for eye-safe systems with limited emission and repetition rates.
4 Conclusion and outlook
Aiming for a compact NLOS localization system, applicable to scenarios outside the laboratory, illumination schemes for limited laser emission and compensation for the compact but long-pulse laser diodes have been examined. Since the reconstruction resolution of NLOS systems depends heavily on temporal detection resolution, the demonstrator presented, which is based on LiDAR hardware with comparatively low-resolution, cannot compete with state-of-the-art systems. However, this platform offers a photon-efficient and eye-safe solution to localization problems outside the direct field of view when exact scene replication is not required.
It was shown that multiple illumination positions can improve NLOS localization performance in two ways of systems that compile with eye-safety restrictions. First, separated laser sources allow for multiplication of emitted signal that can be distributed more equally across the NLOS scene. This reduces performance variations that depend on the target position in comparison to single illumination schemes. Second, increased variation of illumination and detection pairs further confine the feasible target position as explicitly elaborated for the ellipsoid based back-projection reconstruction.
For single target localization scenarios, LoG based edge filtering of the reconstruction as commonly done in FBP NLOS imaging does not adequately counteract pulse-width-induced temporal smearing that enlarges the feasible target region. Preprocessing the temporal measurement data by explicitly managing pulse widths outperforms filtering of the reconstruction result. Matched filtering was used to incorporate all signal photons received, posing an additional advantage over spatial edge detection that relies only on the first part of the pulse form. This fits in with the endeavor to develop a photon-efficient NLOS system, to address the limited emissions in eye-safe operation.
The presented system can be developed further into a hybrid LiDAR-NLOS system with an additional spatially broadened laser source that illuminates the detector’s field of view, known as solid-state Flash-LiDAR. A direct ToF measurement can determine the orientation and the system’s position relative to the relay wall, which is necessary to process the NLOS measurement. One application of this eye-safe compact hybrid system could be the localization of persons beyond the line of sight on an upper floor through a window, using the ceiling as the relay wall.
Funding
This research received no external funding.
Conflicts of interest
The authors have nothing to disclose.
Data availability statement
The original contributions presented in this study are included in the article. Further inquiries can be directed to the corresponding author.
Author contribution statement
Conceptualization, K.A. and M.L.; Methodology, K.A. and J.K.; Software, K.A. and J.K.; Validation K.A., J.K. and M.L.; Investigation, K.A.; Writing – Original Draft Preparation, K.A. and J.K.; Writing – Review & Editing, J.K., M.L. and A.G; Visualization, K.A. and J.K.; Supervision, M.L. and A.G.
All authors have read and agreed to the submitted version of the manuscript.
References
- Klein J, Peters C, Martín J, Laurenzis M, Hullin MB, Tracking objects outside the line of sight using 2D intensity images, Sci. Rep. 6, 32491 (2016). https://doi.org/10.1038/srep32491. [Google Scholar]
- Musarra G, Lyons A, Conca E, Villa F, Zappa F, Altmann Y, Faccio D, in Imaging and Applied Optics 2019 (COSI, IS, MATH, pcAOP) (OSA, Washington, D.C.), IM2B.5. https://doi.org/10.1364/ISA.2019.IM2B.5. [Google Scholar]
- Lindell DB, Wetzstein G, Koltun V, in 2019 IEEE/CVF Conference on Computer Vision and Pattern Recognition (CVPR) (IEEE, 2019), p. 6773. https://doi.org/10.1109/CVPR.2019.00694. [Google Scholar]
- Maeda T, Wang Y, Raskar R, Kadambi A, in 2019 IEEE International Conference on Computational Photography (ICCP) (IEEE, 2019), p. 1. https://doi.org/10.1109/ICCPHOT.2019.8747343. [Google Scholar]
- Wu C, Liu J, Huang X, Li ZPC, Yu JT, Ye J, Zhang Q, Zhang X, Dou VK, Goyal F, Xu JWP, Non-line-of-sight imaging over 1.43 km, Proc. Natl. Acad. Sci. USA 118 (2021). https://doi.org/10.1073/pnas.2024468118. [Google Scholar]
- Zhang W, Zhu S, Chen L, Bai L, Lam EY, Guo E, Han J, High-resolution and real-time non-line-of-sight imaging based on spatial correlation, Opt. Lasers Eng. 193, 109100 (2025). https://doi.org/10.1016/j.optlaseng.2025.109100. [Google Scholar]
- Nam JH, Brandt E, Bauer S, Liu X, Renna M, Tosi A, Sifakis E, Velten A, Low-latency time-of-flight non-line-of-sight imaging at 5 frames per second, Nat. Commun. 12, 6526 (2021). https://doi.org/10.1038/s41467-021-26721-x. [Google Scholar]
- O’Toole M, Lindell DB, Wetzstein G, Confocal non-line-of-sight imaging based on the light-cone transform, Nature 555, 338 (2018). https://doi.org/10.1038/nature25489. [Google Scholar]
- Faccio D, Velten A, Wetzstein G, Non-line-of-sight imaging, Nat. Rev. Phys. 2, 318 (2020). https://doi.org/10.1038/s42254-020-0174-8. [Google Scholar]
- Liu X, Wang J, Xiao L, Shi Z, Fu X, Qiu L, Non-line-of-sight imaging with arbitrary illumination and detection pattern, Nat. Commun. 14, 3230 (2023). https://doi.org/10.1038/s41467-023-38898-4. [Google Scholar]
- Wang K, Zhang M, Shi Y, in Fourth International Computational Imaging Conference (CITA 2024), edited by X. Shao (SPIE, 2024), p. 40. https://doi.org/10.1117/12.3055473. [Google Scholar]
- Zhao Z, Zhang Q, Li X, Guo Y, Pu M, Zhang F, Guo H, Wang Z, Fan Y, Xu M, Luo X, High-resolution non-line-of-sight imaging based on liquid crystal planar optical elements, Nanophotonics (Berlin, Germany) 13, 2161 (2024). https://doi.org/10.1515/nanoph-2023-0655. [Google Scholar]
- Jin C, Tang M, Jia L, Tian X, Yang J, Qiao K, Zhang S, Scannerless non-line-of-sight three dimensional imaging with a 32x32 SPAD array, arXiv preprint arXiv:2011.05122, 2020. [Google Scholar]
- Zhang W, Guo E, Zhu S, Huang C, Chen L, Liu L, Bai L, Lam EY, Han J, Real-time scan-free non-line-of-sight imaging, APL Photon. 9 (2024). https://doi.org/10.1063/5.0235687. [Google Scholar]
- Haase JF, Grollius S, Grosse S, Buchner A, Ligges M, in Photonic Instrumentation Engineering VIII, edited by Y. Soskind, L.E. Busse (SPIE, 2021), p. 20. https://doi.org/10.1117/12.2578775. [Google Scholar]
- Leitel R, Dannberg P, Seise B, Brüning R, Grosse S, Ligges M, in Optical Sensing and Detection VIII, edited by F. Berghmans, I. Zergioti (SPIE, 2024), p. 71. https://doi.org/10.1117/12.3023124. [Google Scholar]
- Liu X, Bauer S, Velten A, Phasor field diffraction based reconstruction for fast non-line-of-sight imaging systems, Nat. Commun. 11, 1645 (2020). https://doi.org/10.1038/s41467-020-15157-4. [Google Scholar]
- Lindell DB, Wetzstein G, O’Toole M, Wave-based non-line-of-sight imaging using fast f-k migration, ACM Trans. Graph. 38, 1 (2019). https://doi.org/10.1145/3306346.3322937. [Google Scholar]
- Zheng Y, Wang W, Zhang C, Zhang Y, Zhang Q, Li L, Converting non-confocal measurements into semi-confocal ones with timing-accuracy improving for non-line-of-sight imaging, Opt. Lasers Eng. 176, 108067 (2024). https://doi.org/10.1016/j.optlaseng.2024.108067. [Google Scholar]
- Laurenzis M, Velten A, Feature selection and back-projection algorithms for nonline-of-sight laser–gated viewing, J. Electron. Imaging 23, 63003 (2014). https://doi.org/10.1117/1.JEI.23.6.063003. [Google Scholar]
- Feng X, Gao L, Improving non-line-of-sight image reconstruction with weighting factors, Opt. Lett. 45, 3921 (2020). https://doi.org/10.1364/OL.394742. [Google Scholar]
- Velten A, Willwacher T, Gupta O, Veeraraghavan A, Bawendi MG, Raskar R, Recovering three-dimensional shape around a corner using ultrafast time-of-flight imaging, Nat. Commun. 3, 745 (2012). https://doi.org/10.1038/ncomms1747. [Google Scholar]
- Gu C, Sultan T, Masumnia-Bisheh K, Waller L, Velten A, in 2023 IEEE International Conference on Computational Photography (ICCP) (IEEE, 2023), p. 1. https://doi.org/10.1109/ICCP56744.2023.10233262. [Google Scholar]
- Liu X, Wang J, Li Z, Shi Z, Fu X, Qiu L, Non-line-of-sight reconstruction with signal-object collaborative regularization, Light Sci. Appl. 10, 198 (2021). https://doi.org/10.1038/s41377-021-00633-3. [Google Scholar]
All Figures
|
Figure 1 a) Top-view schematic of the NLOS setup. b) Front-view of the relay wall. The black square represents the projected target position. |
| In the text | |
|
Figure 2 a) NLOS measurement process with two Lambertian scatterings indicated with red arrows. Dashed arrows indicate pulse propagation. b) Resulting ellipses of possible target reflections that could have produced the measured data of detection positions 4 and N (blue circles) from illumination position 1 (red circle). The intersection indicates the actual target position. c) Overlapping ellipses for finite pulse width of a centrally positioned target. Ellipses I and II originate from laser position 1 (red circle) and detection position 1 and N respectively. Ellipse III originates from laser position 2 and detection position N, confining the light grey area to the dark grey area. |
| In the text | |
|
Figure 3 Receivable signal on the detection area per target position a) for one illumination position to the left of the detection area, b) for two illumination positions around the detection area, c) for a central illumination. d) Target positions where the central illumination yields more signal than the dual illumination scheme. |
| In the text | |
|
Figure 4 a) Top-view schematic of the NLOS setup with indicated target and illumination positions. b–d) 2D slices of the simulated unfiltered ellipsoid based reconstruction volume for laser position 1 and 2 and for the superposition of both, e) for a target off the symmetry axis by 0.5 m to the right. White arrows indicate the target position. |
| In the text | |
|
Figure 5 a) Simulated illumination dependent localization errors per number of measurements on the symmetry plane, b) near laser position 1. c) Localization errors for lateral target displacement at 1,250 measurements, and d) at 50,000 measurements. |
| In the text | |
|
Figure 6 a) Measured localization errors for different measurement statistics. b–d) Extracted lateral target positions of 100 repetitions with 1,250 (b), 5,000 (c) and 50,000 (d) measurements per reconstruction. Histograms show the distribution of extracted target positions for a single illumination (top and right, blue histograms) and superposed reconstructions (bottom and left, yellow histograms) of each lateral axis. The black cross indicates the actual target position. |
| In the text | |
|
Figure 7 a) Simulated localization errors for filter combinations of no temporal filtering, Gaussian filtering and matched filtering with an optional spatial LoG edge detection. b) Corresponding resulting target positions per temporal filter at 12,500 measurements per reconstruction and a laser pulse width six times the detector’s temporal resolution and c) with additional LoG edge detection in the reconstruction volume. The red dots denote the nominal target position. |
| In the text | |
|
Figure 8 Simulated localization errors for different laser pulse widths at 12,500 measurements using different filter combinations. |
| In the text | |
Current usage metrics show cumulative count of Article Views (full-text article views including HTML views, PDF and ePub downloads, according to the available data) and Abstracts Views on Vision4Press platform.
Data correspond to usage on the plateform after 2015. The current usage metrics is available 48-96 hours after online publication and is updated daily on week days.
Initial download of the metrics may take a while.