Figure 6
Download original image
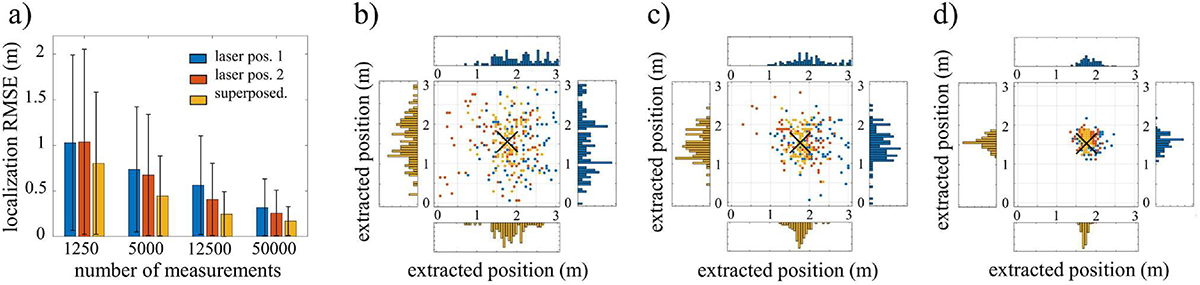
a) Measured localization errors for different measurement statistics. b–d) Extracted lateral target positions of 100 repetitions with 1,250 (b), 5,000 (c) and 50,000 (d) measurements per reconstruction. Histograms show the distribution of extracted target positions for a single illumination (top and right, blue histograms) and superposed reconstructions (bottom and left, yellow histograms) of each lateral axis. The black cross indicates the actual target position.
Current usage metrics show cumulative count of Article Views (full-text article views including HTML views, PDF and ePub downloads, according to the available data) and Abstracts Views on Vision4Press platform.
Data correspond to usage on the plateform after 2015. The current usage metrics is available 48-96 hours after online publication and is updated daily on week days.
Initial download of the metrics may take a while.