Figure 2
Download original image
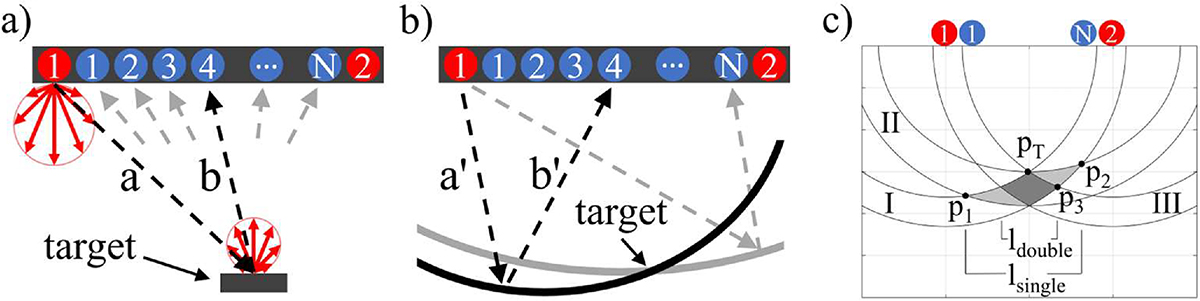
a) NLOS measurement process with two Lambertian scatterings indicated with red arrows. Dashed arrows indicate pulse propagation. b) Resulting ellipses of possible target reflections that could have produced the measured data of detection positions 4 and N (blue circles) from illumination position 1 (red circle). The intersection indicates the actual target position. c) Overlapping ellipses for finite pulse width of a centrally positioned target. Ellipses I and II originate from laser position 1 (red circle) and detection position 1 and N respectively. Ellipse III originates from laser position 2 and detection position N, confining the light grey area to the dark grey area.
Current usage metrics show cumulative count of Article Views (full-text article views including HTML views, PDF and ePub downloads, according to the available data) and Abstracts Views on Vision4Press platform.
Data correspond to usage on the plateform after 2015. The current usage metrics is available 48-96 hours after online publication and is updated daily on week days.
Initial download of the metrics may take a while.