| Issue |
J. Eur. Opt. Society-Rapid Publ.
Volume 22, Number 1, 2026
EOSAM 2025
|
|
|---|---|---|
| Article Number | 41 | |
| Number of page(s) | 4 | |
| DOI | https://doi.org/10.1051/jeos/2026033 | |
| Published online | 19 May 2026 | |
Short Communication
Verifying optical simulations for infrared curing of powder coatings
1
digitX GbR, Östlicher Dammweg 36, D-83052 Bruckmühl, Germany
2
Technische Hochschule Aschaffenburg, D-63743 Aschaffenburg, Germany
3
NETZ Technologietransferzentrum für nachhaltige Energien, D-63755 Alzenau, Germany
* Corresponding author: This email address is being protected from spambots. You need JavaScript enabled to view it.
Received:
29
December
2025
Accepted:
26
March
2026
Abstract
In line with the energy transition, it is desirable to replace fossil fuels in the curing process of industrial powder coatings. Infrared heating is the considered method here. Near Infra Red-emitter arrangement in the reflective heating chamber, their geometry and the dwell time of the components are crucial for a successful and efficient process. Process optimization has to consider the optical parameter variation of the powder coating during the procedure. Measurements in the NAPUBEST (“Nachhaltige Pulverbeschichtungs-Technologie”: sustainable powder coating technology) prototype are compared with optical simulations of the setup to get the simulation parameters in agreement with reality and to provide a foundation for the layout of industrial processes.
Key words: IR-curing / Optical simulation / Powder coating / Sustainable energy transition / Infrared heating
These authors contributed equally to this work.
© The Author(s), published by EDP Sciences, 2026
 This is an Open Access article distributed under the terms of the Creative Commons Attribution License (https://creativecommons.org/licenses/by/4.0), which permits unrestricted use, distribution, and reproduction in any medium, provided the original work is properly cited.
Introduction
The recent energy crisis revealed the dependence of many manufacturing companies on fossil fuels. Industrial processes need to be transformed into sustainable alternatives. For powder coatings, which traditionally rely on gas or oil heating systems, short wave infrared radiation e.g. from infrared heating emitters can deliver the required process heat. It is an approved method for flat steel strip surfaces in the steel industry [1]. The strong dependence of the IR absorption on the geometry of the irradiated parts as well as on the colour and sort of the coating powder [2, 3] has to be considered before the deployment of this innovative heating. The aim of the NAPUBEST project (German abbreviation for “Nachhaltige Pulverbeschichtungs-Technologie” which means “Sustainable Powder Coating Technology”) is to get a better understanding of these correlations. In our laboratory, we created a prototype of an octagonal IR oven for test measurements. The high reflectivity of silver-coated reflector sheets facilitates the concentration of infrared radiation inside the oven. On the other hand, the absorption of powder-coated samples in different paint colours has an impact on the heating efficiency. The arrangement of the Near Infra Red (NIR)-emitters in the reflective heating chamber, the geometry and the dwell time of the components are therefore crucial for a successful and efficient process. Process optimisation has to consider various optical and mechanical parameters for different coatings and components. Some of the parameters are also subject to change during the curing procedure.
The objective of this investigation is the verification of a simple simulation model with simplified optical parameters that can be easily adapted and used during production.
Simulation model and heating tests
The NAPUBEST heating chamber is made of Alanod Miro Silver sidewalls and a Heraeus Noblelight M220x511 NIR/SWIR heating module with 4 fast short wave emitters (1.5 kW, 1.4 μm peak wavelength each) [4]. The high reflectivity of the Alanod sheets guarantees a homogeneous radiance inside the chamber (except in front of the infrared emitters). For the optical simulations, the program FRED from Photon Engineering was used. The geometry of the heating chamber was exactly reproduced in the simulation model. The heating module was represented by the aluminum backside of the emitter-mount, the fused silica glass cover and the 4 emitter tubes. The filaments of the emitters were simulated as an emitting tube.
Since the heating chamber has no facility (yet) to hang the samples into the middle of the chamber they were placed onto the bottom sheet. The same position was used in the simulation (see Fig. 1). Free hanging as in conventional gas ovens will be beneficial since the light will reach all sides of the sample and is planned to be implemented as a next step.
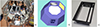 |
Figure 1 (a) NAPUBEST IR-oven with sample placed at the bottom of the chamber, (b) same arrangement in the simulation model of NAPUBEST IR-oven including the sample placed at the bottom of the chamber, (c) black coated sample. |
For the verification, the CAD model of the specimen used in industrial fabrication and in the NAPUBEST oven was imported into FRED. The full surface of the specimen was used as the detector surface. The absorbed irradiance at the surface was simulated and the resulting irradiance map was exported as a CSV-file for post processing.
The optical properties of all materials in the heating chamber were either taken from vendor data (fused silica transmittance and refractive index, reflectivity of emitter mount and gold coating of emitter backside) or measured using an Ulbricht Sphere for all other materials (see Fig. 2). The black and white coating were found to be perfectly Lambertian: the HDR and DDR measurements had the same result, thus there is no specular fraction. For Alanod the two quantities have quite different values, resulting in a high specular fraction of the reflectivity, which is expected.
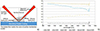 |
Figure 2 (a) Description of different parts of reflection on a surface, (b) comparison of HDR (Hemispherical Directional Reflectivity) and DDR (Diffuse Hemispherical Directional Reflectivity) measurement in an Ulbricht Sphere of cured white and black powder coating and Alanod sheet. HDR and DDR are identical for the two coatings indicating a Lambertian scatter whereas the two are quite different for the high specular Alanod. |
Measurements and vendor data were used to create material, coating and scatter data [5] in FRED for the peak wavelength of the emitters only. This simplification largely reduced the simulation time.
As a first test of the equipment and the correspondence between experiment and simulation, a black and a white coated sample were heated for 2 min each in the NAPUBEST heating chamber. The sample was placed into the oven chamber as shown in Figure 1 and the chamber was closed by the Alanod-covered front lid. All four emitters were running with full power for 2 min before the lid was re-opened and the temperature distribution was captured by an infrared camera 0, 1 and 2 min later (Testo 883, 640 × 480 pixel). The corresponding simulation takes into account four emitters at full power and the respective BSDF of the coatings.
Results
The temperatures of the specimen after 2 min of infrared irradiation were measured with the Testo infrared camera. Especial care had to be taken to not measure heat reflections of the lamps or of hot spots which get reflected on colder parts of the sample. The reflecting sheets of the heating chamber create a mirror image of the sample with the advantage of making the down facing surfaces of the sample visible.
The simulation results were displayed in an in-house developed software allowing the readout of surface irradiance point or linewise. The results for maximum and minimum temperature as well as the corresponding irradiance are shown in Table 1. Regarding ratio and over all distribution, the measurement and simulation are in good accordance (see Fig. 3). As expected, the temperature of the black sample was much higher than that of the white sample after the same dwell time in the oven due to the higher infrared absorption.
Results for maximum/minimum values of simulated irradiance and measured temperature of the white and black sample (Values in the holes are excluded).
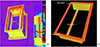 |
Figure 3 Simulation (b) and heating results (a) for the black sample. The ratio of temperatures matches the ratio of irradiances at the main surfaces of the sample. The red color corresponds here to higher temperatures while yellow/green resembles lower temperatures. |
The temperature distribution though showed differences compared to the irradiance distribution (see Fig. 4) that we attribute to heat flow and heat transfer in the system, e.g. at the point of support, the temperature is lower than the mean surface temperature while the irradiance is more or less homogenously distributed over the side surface of the sample.
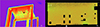 |
Figure 4 Detailed results of simulation and infrared camera show differences due to heat flow inside the sample. The side wall in the IR-picture (a) shows a heat sink at the bottom: heat flow to Alanod sheets. The pure ray trace simulation (b) does not show a lower irradiance at the bottom of the side surface. |
Discussion
Earlier simulations with a simple T-shaped sample [6] showed that inhomogeneities in irradiance at the sample surface can be prevented by illuminating the sample from different positions. It allowed to reduce the max/min ratio of the irradiance from 4.2 to 1.9 for the T-shaped sample. In the real world this means to turn the sample in the oven and/or install multiple heating modules in the oven.
The optical parameters of cured powder coating can be measured easily with an Ulbricht sphere and converted into simplified scatter models. The results of this investigation show that this is sufficient to map the simulations to the measurements. Heating results strongly depend on the coating colour and sample geometry as expected. The thermal effects like thermal conduction exceed the expected magnitude and need to be taken into account.
Conclusion
These first results show that it is possible to predict the heating of complicated geometries by IR irradiation with sufficient precision. The simulation model with simplified scatter models for the powder coating delivers accurate results to predict the required heating power. Differences between the temperature distribution in the thermal images and the irradiance distributions are evidence for the need to include thermal effects into the model for more accurate predictions.
The next challenge will be to create a process and as a long term objective a tool which helps to define irradiation power sequences that lead to a more homogenous temperature distribution for easy and fast use at the production line.
Outlook
Next steps will be the investigation of different heating profiles with periods of reduced power to keep the temperature level after initial heating and to verify sufficient temperature homogeneity at the sample surface. This is vital for the application in powder coating with respect to the narrow curing process window of industrial powders. An additional thermal simulation using the results of the optical simulation as input will be carried out to include heat flow inside the sample and convection. When feasibility of the process in principle has proven, a larger research project will be initialised to investigate processes during the curing of the powder and possible impacts of the coating colour on the process.
Glossary
NIR: Near Infra Red
SWIR: Short Wave Infra Red
NAPUBEST: Nachhaltige Pulverbeschichtungs-Technologie: sustainable powder coating technology
NETZ: Technology Transfer Center for Sustainable Energies
BSDF: Bidirectional Scatter Distribution Function
FRED: Optical simulation software for non sequential ray tracing by Photon Engineering
HDR/THR: Hemispherical Directional Reflectivity (includes specular reflection) / Total Hemispherical Reflection
DDR/DHR: Diffuse Hemispherical Directional Reflectivity (excludes specular reflection) / Diffuse Hemispherical Reflection)
Funding
This research was funded by The Bavarian State Ministry of Science and the Arts within the scope of the transfer initiative Hightech Transfer Bayern. The Bavarian State Ministry of Science and the Arts has granted start-up funding of €5 million to Aschaffenburg University of Applied Sciences to establish a technology transfer centre for sustainable energy (NETZ) in Alzenau / Germany, together with regional companies and municipal partners.
Conflicts of interest
The authors have nothing to disclose.
Data availability statement
The research data are available on request from the authors.
Author contribution statement
Conceptualization, T.D., E.S. and M.K..; Methodology, T.D., E.S. and M.K..; Validation, T.D., E.S. and M.K.; Formal Analysis, M.K.; Writing – Original Draft Preparation, M.K.; Writing – Review & Editing, T.D., E.S..; Visualization, M.K.; Project Administration, M.K.; T.D.; Funding Acquisition, T.D.
References
- Stewart A.L., et al., Characterization of infrared absorption by powder coatings on steel panels. J. Coat. Technol. 71, 71–84 (1999). https://doi.org/10.1007/BF02697891. [Google Scholar]
- Barletta M., Flash IR pre-curing of the decorative layer in metal-flake powder coatings. J. Prog. Org. Coat. 72(3), 498–510 (2011). https://doi.org/10.1016/j.porgcoat.2011.06.009. [Google Scholar]
- von Horstig M.-W. et al., A perspective on innovative drying methods for energy-efficient solvent-based production of lithium-ion battery electrodes, Energy Technol. 10 (2022). 2200689. https://doi.org/10.1002/ente.202200689. [Google Scholar]
- Stanik E. et al., Infrared heating for a sustainable powder coating technology, DGaO Proc. 2025. [Google Scholar]
- Fest E.C. (2013). Stray light analysis and control. https://doi.org/10.1117/3.1000980. [Google Scholar]
- Kroneberger M. et al., Optik-Simulation für die Energiewende am Beispiel eines industriellen Infrarot-Heizofens, DGaO Proc. 2025. [Google Scholar]
All Tables
Results for maximum/minimum values of simulated irradiance and measured temperature of the white and black sample (Values in the holes are excluded).
All Figures
|
Figure 1 (a) NAPUBEST IR-oven with sample placed at the bottom of the chamber, (b) same arrangement in the simulation model of NAPUBEST IR-oven including the sample placed at the bottom of the chamber, (c) black coated sample. |
| In the text | |
|
Figure 2 (a) Description of different parts of reflection on a surface, (b) comparison of HDR (Hemispherical Directional Reflectivity) and DDR (Diffuse Hemispherical Directional Reflectivity) measurement in an Ulbricht Sphere of cured white and black powder coating and Alanod sheet. HDR and DDR are identical for the two coatings indicating a Lambertian scatter whereas the two are quite different for the high specular Alanod. |
| In the text | |
|
Figure 3 Simulation (b) and heating results (a) for the black sample. The ratio of temperatures matches the ratio of irradiances at the main surfaces of the sample. The red color corresponds here to higher temperatures while yellow/green resembles lower temperatures. |
| In the text | |
|
Figure 4 Detailed results of simulation and infrared camera show differences due to heat flow inside the sample. The side wall in the IR-picture (a) shows a heat sink at the bottom: heat flow to Alanod sheets. The pure ray trace simulation (b) does not show a lower irradiance at the bottom of the side surface. |
| In the text | |
Current usage metrics show cumulative count of Article Views (full-text article views including HTML views, PDF and ePub downloads, according to the available data) and Abstracts Views on Vision4Press platform.
Data correspond to usage on the plateform after 2015. The current usage metrics is available 48-96 hours after online publication and is updated daily on week days.
Initial download of the metrics may take a while.