Fig. 4
Download original image
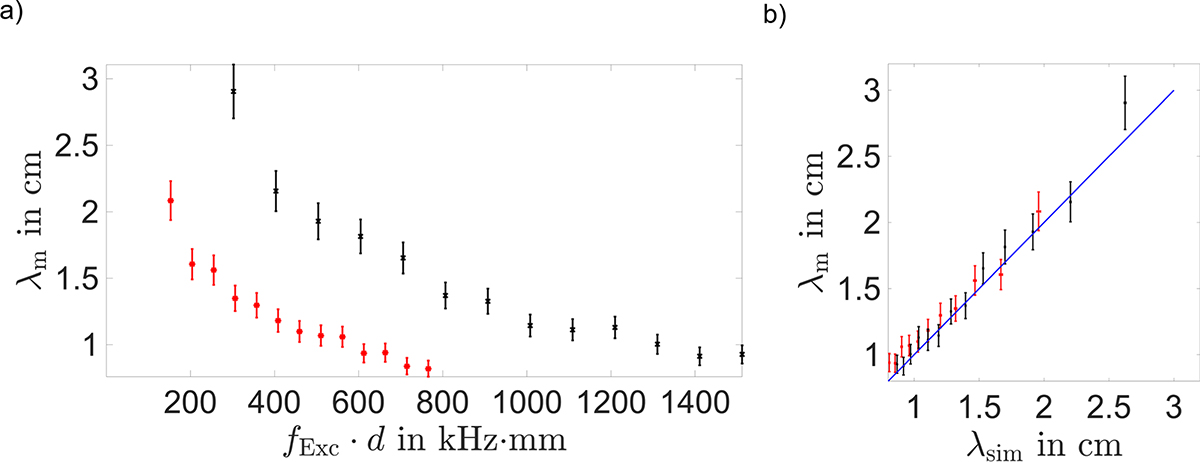
a) GUWs on aluminum plates with different thickness d1 = 2.6 mm (red) and d2 = 5.0 mm (black) are excited at different frequencies fExc = [60, 300] kHz in steps of 20 kHz. By means of digital holography, the surface deformation is then measured and evaluated with the structure function to determine the wavelength λm of the GUW, which is plotted against fExc ·⋅d. The thinner plate shows shorter wavelengths. b) The measured wavelengths are plotted against the resulting wavelengths from the simulation for the A0 mode λsim. The blue line marks the ideal result for the case of λm = λsim, corresponding to a slope of m = 1. The experimental results are in agreement with the simulation results for both samples. The corresponding slopes are m1 = 0.95 and m2 = 1.08. This successfully qualifies our measurement method for the measurement and characterization for GUWs.
Current usage metrics show cumulative count of Article Views (full-text article views including HTML views, PDF and ePub downloads, according to the available data) and Abstracts Views on Vision4Press platform.
Data correspond to usage on the plateform after 2015. The current usage metrics is available 48-96 hours after online publication and is updated daily on week days.
Initial download of the metrics may take a while.