


| Issue |
J. Eur. Opt. Society-Rapid Publ.
Volume 22, Number 1, 2026
|
|
|---|---|---|
| Article Number | 43 | |
| Number of page(s) | 12 | |
| DOI | https://doi.org/10.1051/jeos/2026037 | |
| Published online | 25 May 2026 | |
Research Article
SIM-AIR dataset and YOLO-KMM model for air-to-air infrared small target detection
Shijiazhuang Campus, Army Engineering University of PLA, Shijiazhuang 050003, PR China
* Corresponding author: This email address is being protected from spambots. You need JavaScript enabled to view it.
Received:
25
January
2026
Accepted:
8
April
2026
Abstract
To address the lack of dedicated datasets for infrared detection of small UAVs in air-to-air scenarios, this paper first constructs the self-built SIM-AIR dataset covering complex scenarios, and then proposes YOLO-KMM an efficient YOLOv11-based object detection model tailored to the dataset’s small-target characteristics and deployment requirements; collected by an UAV equipped with an infrared thermal imager, the SIM-AIR dataset consists of 3,993 precisely annotated images across four weather conditions: sunny, cloudy, snowy, and hazy, where 99.7% of the targets are ultra-small objects and their width < 40 pixels, with an average size of 11.2 × 6.6 pixels, including complex scenarios such as “dark targets” in snowy weather and low signal-to-noise ratio (SNR) in haze, which fully simulate real-world detection challenges. To tackle the issues of sparse small-target features and strong background interference, YOLO-KMM integrates the C2KD feature enhancement module and C3K2-MU lightweight detection head, forming a dual-optimized architecture of “feature enhancement – efficient detection”: the C2KD module captures weak small-target features and suppresses noise via cross-scale fusion and attention mechanisms, while the C3K2-MU module adopts grouped convolution and depthwise separable convolution to reduce the number of parameters while preserving feature representation capability. Experiments on the SIM-AIR dataset show that YOLO-KMM achieves an mAP50 of 88.2%. This is 7.8% points higher than the baseline YOLOv11, with a precision of 94.0% and recall of 74.3%, reduces the small-target missed detection rate by 12.5%, and maintains an inference speed of 246.18 FPS, 2.3M parameters, and 5.4 GFLOPs of computation; compared with YOLOv5/8/12, the model achieves a better balance among accuracy, speed, and complexity, verifying the practicality and challenge of the SIM-AIR dataset and providing an efficient solution for air-to-air small-target infrared detection.
Key words: Air-to-air infrared detection / Small UAV target / SIM-AIR dataset / YOLO-KMM model / Feature enhancement / Lightweight object detection
© The Author(s), published by EDP Sciences, 2026
 This is an Open Access article distributed under the terms of the Creative Commons Attribution License (https://creativecommons.org/licenses/by/4.0), which permits unrestricted use, distribution, and reproduction in any medium, provided the original work is properly cited.
1 Introduction
The detection of small air-to-air drones has become a crucial technological necessity in the fields of civilian security, transportation, and emergency rescue. In civil aviation, the International Civil Aviation Organization (ICAO) recorded over 1,200 near-miss incidents between drones and aircraft in 2023, 68% of which occurred in low-altitude airspace where conventional radar fails, with single incidents potentially causing economic losses of several million dollars. In emergency rescue scenarios, collisions caused by complex weather conditions such as smoke, rain, or snow often result in monitoring interruptions and rescue delays. With the development of urban air mobility (UAM), the global civilian drone fleet is expected to exceed 20 million units by 2026, creating an urgent demand for real-time collision avoidance technology in low-altitude airspace.
Infrared detection has become a core solution due to its all-weather operational capability, but existing technologies struggle with challenges such as ultra-small targets, low signal-to-noise ratios, and limited UAV platform resources, and also lack dedicated datasets. To address this, this paper constructs the SIM-AIR dataset and proposes the YOLO-KMM model, specifically tackling these practical challenges and providing a practical technical solution for airborne infrared small target detection.
As a core research direction in computer vision, object detection focuses on fast and accurate target localization and category recognition, and has been widely applied in scenarios such as security monitoring, industrial quality inspection, and intelligent transportation. In recent years, single-stage object detectors represented by the YOLO series have become the preferred solution for real-time detection scenarios due to their end-to-end training mode and efficient inference performance. From YOLOv1 to the latest YOLOv11, models have continuously broken through in accuracy and speed through backbone network optimization and feature fusion mechanism upgrades [1]; however, in specific scenarios like air-to-air UAV infrared detection, two core bottlenecks remain: the lack of dedicated datasets, and the balance between small-target detection and lightweight deployment.
Air-to-air small UAV detection has distinct particularities: targets are at long distances with extremely low pixel occupancy, are highly affected by weather changes, and infrared images often suffer from low signal-to-noise ratio (SNR) and weak target-background contrast [2]. However, existing public datasets mostly focus on ground targets or conventional visual scenarios, lacking exclusive data support for air-to-air UAV infrared detection and thus failing to fully cover the complex characteristics and detection difficulties of this scenario [3]. To fill this gap, this paper constructs the self-built SIM-AIR dataset for air-to-air UAV infrared target detection, the data was collected using real-scene acquisition methods, with a drone carrying an infrared thermal imaging camera to complete the collection work. The infrared thermal imaging camera has a thermal sensitivity of ≤50 mk, an image resolution of 640 × 512 pixels, and a spectral range of 7.5–13.5 μm [4]. The collected dataset covers four typical weather conditions: sunny, cloudy, snowy, and smoggy. Among them, there are 2,043 sunny samples, accounting for 51.3% of the total samples; 787 cloudy samples, accounting for 19.7%; 620 snowy samples, accounting for 15.5%; and 543 smoggy samples, accounting for 13.5%. The entire dataset contains 3,993 valid images, all of which include civilian small drone targets [5]. The targets belong to a single category, with a body size ranging from 0.3 to 0.8 m. Tatistical analysis reveals that 99.7% of the targets in the dataset are ultra-small objects [6]. All these targets have a width of less than 40 pixels, with an average width of 11.2 pixels and an average height of 6.6 pixels, as shown in Figure 1 (the dataset samples under weather conditions are presented); additionally, target SNR varies significantly across weather conditions: hazy days have an SNR as low as −0.09, while snowy days exhibit “reverse contrast” (target grayscale lower than background) with an SNR of −0.30 [7]. These characteristics enable the SIM-AIR dataset to accurately simulate the core challenges of actual air-to-air detection, providing high-quality data support for related research.
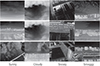 |
Figure 1 Sample images from the dataset. |
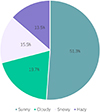 |
Figure 2 Proportion of the dataset under different weather conditions. |
Although newer versions like YOLOv11 and YOLOv12 have made progress through lightweight architecture design, traditional YOLO models still have obvious shortcomings when facing the SIM-AIR dataset’s ultra-small targets, low SNR, and complex backgrounds: insufficient small-target feature extraction capability, leading to missed or false detections; meanwhile, air-to-air detection deployment platforms (e.g, UAVs, embedded devices) have limited computing resources, and existing high-precision models often come with large computational overhead [8], making it difficult to meet real-time requirements. To address these issues, this paper proposes the improved YOLO-KMM model, which achieves coordinated optimization of detection performance and computational efficiency through targeted module design. The main research contributions of this paper are as follows:
- 1)
Constructed the self-built SIM-AIR dataset for air-to-air UAV infrared detection, covering 4 weather conditions and ultra-small target characteristics, filling the gap of dedicated infrared datasets for air-to-air scenarios, and providing high-quality experimental data for small-target real-time detection research;
- 2)
Proposed the C2KD feature enhancement module, which strengthens the model’s ability to extract and represent weak features of small targets in the SIM-AIR dataset through cross-scale feature fusion and attention mechanisms [9], adapting to detection requirements under low SNR and complex backgrounds;
- 3)
Designed the C3K2-MU lightweight detection head, which uses grouped convolution and channel optimization strategies to reduce parameters and computation while ensuring detection accuracy [10], meeting deployment requirements in resource-constrained scenarios;
- 4)
Conducted comparative experiments with multiple mainstream YOLO models on the SIM-AIR dataset, fully verifying the comprehensive advantages of the proposed model in accuracy, speed, and computational complexity, and providing a practical technical solution for air-to-air small-target infrared detection;
- 5)
The subsequent structure of this paper is arranged as follows: Section 2 details the construction process and feature analysis of the SIM-AIR dataset, as well as the design scheme of the YOLO-KMM model; Section 3 verifies the model’s effectiveness through ablation experiments and performance comparison experiments; Section 4 summarizes the research results and looks forward to future directions.
2 Method
2.1 Self-built UAV air-to-air infrared dataset
2.1.1 Data acquisition
The UAV air-to-air infrared dataset used in this study is constructed based on real-scene data acquisition, aiming to address the scarcity of dedicated datasets for infrared detection of small UAVs in air-to-air scenarios.
This research utilized a multi-rotor unmanned aerial vehicle (UAV) equipped with a professional infrared thermal imaging camera to conduct air-to-air infrared data collection. The camera’s spectral response covers the 8–14 μm long-wave infrared band, capable of penetrating through haze, light fog and other meteorological conditions, thereby reducing the interference of atmospheric scattering [11]. With an imaging resolution of 640 × 512 pixels and a pixel pitch of 12 μm, it has a strong spatial resolution capability, allowing for the clear presentation of the contours of extremely small targets even at long distances. The thermal sensitivity is ≤50 mk, enabling precise capture of the thermal radiation differences between targets and backgrounds. Even in low-temperature environments such as snowy days, it can distinguish the gray-scale features of both, supporting the collection of reverse contrast scenes. It supports stable imaging at 30FPS and is equipped with a three-axis mechanical gimbal anti-shake system, effectively compensating for flight attitude jitter and preventing blurring of target images. The field of view is 41.2°–60° and supports multi-level digital zoom, allowing for flexible adjustment of the imaging scale and simulation of the imaging effects of targets at different distances, ensuring the diversity and authenticity of the target size distribution in the dataset.
Acquisition Scenarios: Data are collected in open outdoor airspace and cover four typical weather conditions-sunny days with a pure sky background and no atmospheric attenuation, cloudy days with uneven thermal radiation of the cloud background, snowy days with low ambient temperature and weak target-background contrast, and hazy days with high atmospheric turbidity and low SNR of infrared images-to ensure the dataset’s diversity and practicality.
Dataset Scale: Approximately 4,000 valid infrared images are collected, all containing small UAV targets (single category: civil small UAVs with a fuselage size of 0.3 ∼ 0.8 m). To ensure the fairness and reliability of model training and testing, the dataset is randomly divided into three subsets at a ratio of 7:2:1: 2,800 images for the training set, 800 for the validation set, and 400 for the test set.
2.1.2 Data Annotation
Annotation Tool: All manual annotation of infrared images is completed using the open-source image annotation tool LabelImg, which features a user-friendly graphical interface and supports direct export of YOLO-format annotation files [12].
Annotation Rules: Since the dataset contains only one target category (small UAVs), the annotation strictly follows the YOLO format specification: each image corresponds to a .txt annotation file, where each line records the target’s category ID (small UAVs correspond to ID 0), normalized center coordinates (xcenter, ycenter), and normalized width/height. All parameters are normalized based on the 640 × 512 image resolution. To ensure annotation accuracy, two annotators conducted cross-validation; samples with inconsistent annotations were rechecked and corrected, resulting in a final annotation accuracy of over 99%.
2.1.3 Dataset feature analysis
Target Size Distribution: Statistical analysis is conducted on the size of small UAV targets in infrared images, where target size is defined as the number of pixels in the annotated bounding box. The results show that the average width of targets in the dataset is only 11.2 pixels and the average height is only 6.6 pixels [13]; moreover, ultra-small targets with a width of less than 40 pixels account for as high as 99.7%. This indicates that the dataset is dominated by ultra-small targets, which is highly consistent with the characteristics of long-distance and low pixel occupancy of UAV targets in actual air-to-air detection scenarios, and also highlights the arduousness of object detection tasks in such scenarios.
Weather Characteristic Analysis: The statistical results of sample quantities under different weather conditions are presented in Figure 2: Sunny days account for 51.3% of the dataset with 2043 images, cloudy days for 19.7% with 787 images, snowy days for 15.5% with 620 images, and hazy days for 13.5% with 543 images. This distribution covers both normal and severe weather conditions [14], which can effectively verify the robustness of the model in complex atmospheric environments.
Target Signal-to-Noise Ratio Distribution quantify the difficulty of distinguishing infrared targets from the background under different weather conditions, the grayscale mean values and signal-to-noise ratio (SNR) of target and background regions were calculated. The SNR calculation formula is defined as follows: 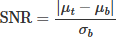 , where
  denotes the grayscale mean of the target region, μt represents the grayscale mean of the background region, and σb stands for the grayscale standard deviation of the background region.
Under cloudy conditions, the grayscale difference between targets and the background is the largest, with an average target grayscale of 146.7 and an average background grayscale of 122.8, corresponding to the highest SNR of 0.42, which makes target features the easiest to identify. Under sunny conditions, the target grayscale of 107.0 is slightly higher than the background grayscale of 96.5, with an SNR of 0.21, indicating that targets have a certain degree of distinguishability. Under hazy conditions, the target grayscale of 90.7 is close to the background grayscale of 96.6, and the SNR is as low as −0.09, meaning that targets are prone to being submerged by background noise. Snowy conditions exhibit a special reverse contrast characteristic: the average target grayscale of 40.0 is significantly lower than the average background grayscale of 59.6, with an SNR of −0.30. In such scenarios, targets become dark targets because their thermal radiation is weaker than that of the low-temperature background, which further increases the detection difficulty. The comparison between the target and the environment is shown in Figure 3.
The above results directly reflect the impact of different weather conditions on infrared target detection. Among them, snowy and hazy days are the core challenging scenarios of this dataset, which also point out the direction for subsequent model improvement.
2.2 The purpose method
In view of the detection pain points of the self-built SIM-AIR dataset, such as the high proportion of ultra-small targets, sparse features, complex background environment and prominent dynamic interference, and combined with the rigid requirements of lightweight model and real-time inference in resource-constrained scenarios such as UAV inspection and embedded equipment, this study proposes an improved YOLO-KMM object detection model, with the core goal of “accurately adapting the characteristics of the dataset, improving the performance of small object detection, and ensuring the feasibility of deployment”. Figure 4 shows the network architecture of YOLO-KMM in detail, and the co-design of the three modules of “feature enhancement, efficient detection, and direction awareness” realizes the collaborative optimization of detection performance and computing efficiency. In terms of specific design, the C2KD feature enhancement module integrates high-level semantic features and low-level detail features by constructing a cross-scale feature fusion channel, and introduces a spatial attention mechanism to achieve precise focus on small target areas, effectively strengthening the characterization of weak features and suppressing background noise, and specially adapting to the characteristics of low signal-to-noise ratio and weak target-background contrast ratio of datasets. Combined with the dynamic channel number optimization strategy, the model parameters and computational amount are greatly reduced under the premise of retaining the effective feature expression ability of the detection head, so as to meet the deployment requirements of resource-limited scenarios. The Conv-M direction sensing module captures the directional characteristics and radiation distribution of small infrared targets through the efficient combination of asymmetric padding, multi-branch parallel convolution and feature splicing, makes up for the lack of directional features caused by atmospheric scattering, and further improves the positioning accuracy of ultra-small targets. The above three modules are integrated into the original YOLOv11 architecture in the form of embedded replacement, and key parameters are optimized according to the target size distribution and category characteristics of the dataset. This improvement idea of “targeted module design and native architecture compatibility” not only avoids the compatibility problems caused by large-scale refactoring, but also accurately matches the scenario requirements of air-to-air infrared detection, and finally ensures that the model achieves the synergistic improvement of small target detection accuracy and inference speed without increasing deployment costs, meeting the dual requirements of practical application scenarios.
2.2.1 C2KD
As the core feature extraction component of YOLO11, the C2PSA module adopts a hybrid architecture combining CSPNet and multi-head self-attention, enabling simultaneous capture of local feature correlations and global feature dependencies. However, the standard self-attention in the original module requires calculating the pairwise similarity between all input tokens, leading to a quadratic increase in computational complexity O(n2) and excessive memory consumption. This issue is particularly prominent when processing high-resolution images or large-scale token sequences, severely limiting the scalability of the model in real-time detection scenarios. To address this limitation, we replace the standard self-attention in C2PSA with our proposed KD mechanism (based on Token Statistical Self-Attention, TSSA) to form the C2KD module. This integration combines the KD mechanism’s computational efficiency with CSPNet’s local feature extraction capability, ultimately achieving a balance between computational efficiency and representational capability. Different from the traditional self-attention based on pairwise similarity, the proposed method adopts an efficient attention computation paradigm based on token statistical features. As shown in the feature map generation process detailed in Figure 5.
The KD module generates discriminative feature maps via a data-driven statistical learning process, which consists of four core steps: token projection, group membership probability estimation, second-order moment calculation, and weighted feature update; the tokenized input feature map Z is first projected into K low-dimensional subspaces through learnable projection matrices {Uk} (k = 1,2, ..., K), yielding the projected token features (UkTZ), then softmax-based group membership probability estimation assigns to each token the probability of belonging to each subspace, forming the group assignment matrix Π, next the empirical second-order moment statistics of token features within each subspace are calculated to measure the “feature strength” inside the group, and finally adaptive weighting coefficients are generated based on these statistics to update the original token features, suppressing irrelevant feature directions and enhancing discriminative feature representation, with the feature optimization process of the KD module formally definable by equation (1): (1)
(1)
Here, Z denotes the input token sequence with the shape B × N × C, where B is the batch size, N is the number of tokens and C is the feature dimension; τ is the gradient step size parameter, and n is the total number of tokens. Uk ∈  ∧ (
∧ ( × p) represents the projection matrix of the k-th attention head (p is the head dimension), and k is the k-th column of the group assignment matrix Π, which records the membership probability of each token belonging to the k-th group.
The theoretical complexity ratio between KD and standard self-attention is shown in the equation (2): (2)
(2)
Since the number of tokens N (e.g., N = 4096 for a 640 × 640 image divided by 16 × 16 patches) is much larger than the feature dimension C (e.g., C = 256 or 512 in YOLO11), the computational cost of TSSA is significantly lower than that of standard self-attention.
To further enhance the feature extraction flexibility of the C2PSA module, the KD mechanism integrates an adaptive group assignment strategy based on token features. Unlike fixed partitioning strategies (e.g., sliding windows or block partitioning), KD dynamically estimates the group assignment matrix Π via equation (3): (3)
(3)
Here zj, denotes the j – th token in Z, η is a learnable temperature parameter, ykj, is the ℓ2 normalization vector of the projected token (ensuring feature scale consistency), and  is a learnable additional bias (used to compensate for cumulative calculation errors in causal scenarios). This adaptive assignment method can allocate tokens with similar semantic features to the same subspace, enhancing the model’s ability to capture semantic-level feature dependencies.
2.2.2 C3K2-MU
The C3K2 module serves as the core feature extraction component in the latest YOLO11 model, which leverages the CSPNet structure to split, process, and fuse input feature maps [15]. However, the traditional bottleneck blocks inside the C3K module adopt linear summation for feature fusion, which struggle to capture complex nonlinear feature correlations [16]; meanwhile, stacked convolutional layers introduce redundant computational overhead. To address these issues, this paper proposes the MU operation, which replaces the traditional bottleneck blocks in the C3K module with MU bottleneck blocks, achieving improved feature representation capability while reducing computational complexity. Unlike conventional bottleneck blocks relying on linear summation, the MU bottleneck block adopts a more efficient and powerful feature fusion strategy centered on the MU operation, whose structure is illustrated in Figure 6.
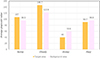 |
Figure 3 Target and background average gray level comparison. |
This operation enables nonlinear interaction between features without explicitly increasing the network width [17], thus enhancing the model’s capability to capture fine-grained feature patterns. The MU module generates enhanced feature maps through an efficient process combining dual-branch parallel convolution and element-wise multiplication. The input feature map X is first fed into a 1 × 1 convolutional layer for channel dimensionality reduction to obtain a dimensionality-reduced feature map; subsequently, this feature map is sent to two parallel 3 × 3 convolution branches to generate two complementary feature maps (F1 and F2) focusing on different feature dimensions; then the MU operation is performed on these two feature maps, capturing the nonlinear correlations between corresponding feature elements via element-wise multiplication; finally, the fused feature map recovers the channel dimension through a 1 × 1 convolutional layer to form the final output feature map (Ffinal). The feature map generation process of the MU module can be expressed as the following equation (4): (4)
(4)
Here, X denotes the input feature map of the MU bottleneck block; Conv–reduce(X) represents the 1 × 1 convolution operation applied to X for channel dimensionality reduction; Conv–branch1 and Conv–branch2 denote two parallel 3 × 3 convolution operations used for feature transformation of the dimensionality-reduced feature map; the symbol ⊗ represents element-wise multiplication between the feature maps F1 and F2 of the two branches; Conv–restore denotes the 1 × 1 convolution operation for restoring the channel dimension of the fused feature map; the introduction of residual connection (summing Conv–reduce(X) and the fused feature map) can alleviate the gradient vanishing problem and retain the original feature information [18].
To further optimize the adaptability of feature extraction, this paper retains the residual connection mechanism of the original C3K module and introduces the ReLU6 activation function after the dual-branch convolution of the MU bottleneck block. ReLU6 constrains the output values within the interval [0,6], which enhances the model’s robustness to numerical instability and improves the inference efficiency on edge devices simultaneously [19]. This combination enables the MU bottleneck block to adaptively capture complex feature correlations according to input content, which significantly enhances the model’s flexibility and representational capability compared with the traditional linear summation method. The improved C3K2 module achieves a better balance between detection accuracy and computational efficiency, and exhibits outstanding performance especially in scenarios with small targets and complex backgrounds. This improved C3K2 module achieves outstanding performance especially in scenarios with small targets and complex backgrounds.
2.2.3 Conv-M
The Conv-M module generates enhanced feature maps through an efficient process combining asymmetric padding, multi-branch parallel convolution and feature concatenation [20]. The input feature map X is first processed by four parallel asymmetric padding convolution operations, where each convolution branch is designed with a dedicated convolution kernel and padding mode for different spatial directions: the horizontal direction adopts a 1 × 3 convolution kernel with left-right asymmetric padding, and the vertical direction adopts a 3 × 1 convolution kernel with top-bottom asymmetric padding, yielding four complementary feature branches (X1, X2, X3, X4). Then, channel concatenation is performed on the feature maps of the four branches to integrate multi-directional feature information. Finally, a 2 × 2 convolutional layer is used for feature fusion and dimension adjustment to generate the final output feature map, the structural process is shown in Figure 7. Batch Normalization and SiLU activation function are appended after each convolution layer throughout the process [21], which ensures training stability and the nonlinear expression capability of features. The feature map generation process of the Conv-M module can be expressed as the following equation (5): (5)
(5)
Here, X1 ∼ X4 denote the output feature maps of the four parallel convolution branches, and their generation methods are as follows equation (6):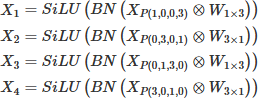 (6)
(6)
Here, XP(left, right, top, bottom) denotes the asymmetric padding of the input feature map X with specified pixels in each direction (the numbers in parentheses are the padding pixel counts for left, right, top and bottom directions respectively); W1×3 and W3×1 represent the directional convolution kernels of 1 × 3 and 3 × 1 respectively; W2×2 denotes the 2 × 2 convolution kernel for final feature fusion; ⊗ is the convolution operator; Cat(·) denotes the channel concatenation operation of feature maps.
Therefore, replacing the standard convolution in the C3K2 module with Conv−M can match the Gaussian distribution characteristics of infrared small targets, strengthen the weak target feature extraction capability through multi-directional feature capture and efficient receptive field expansion, while avoiding redundant computation. This improvement retains the original CSPNet split-fusion structure of the C3K2 module, ensuring compatibility with the overall YOLO11 architecture, and is particularly suitable for scenarios such as infrared small target detection that require capturing the features of weak and small-sized targets.
The Conv-M module described above is integrated as the core building block of the MU bottleneck within the C3K2-MU structure. Specifically, Conv-M handles directional feature capture through asymmetric padding operations, while the MU mechanism applies nonlinear feature fusion. This synergistic design ensures that C3K2-MU simultaneously captures both directional characteristics (via Conv-M) and nonlinear feature correlations (via MU), providing comprehensive feature representation for ultra-small infrared targets.
3 Experiments and results
3.1 Experimental environment
All experiments in this study were conducted on a GeForce RTX 2080 graphics card with 8 GB of video memory. The software environment was configured as follows: Windows 11 operating system, CUDA 12.4 acceleration library, Python 3.13.9 programming language, and PyTorch deep learning framework. The model training was optimized using the Stochastic Gradient Descent (SGD) optimizer, with the batch size set to 12, the initial learning rate configured as 0.01, and the learning rate decay coefficient set to 0.0005. The resolution of input experimental images was uniformly fixed at 640 × 640 pixels.
3.2 Evaluation metrics
To verify the performance of the proposed model, this study selects the following metrics for quantitative evaluation: Precision (P), Recall (R), mean average precision (mAP50), comprehensive mean average precision (mAP50−95), model parameters, and model size. Among them, True Positive (TP) denotes the number of correctly detected targets, False Positive (FP) denotes the number of background regions mistakenly detected as targets, and False Negative (FN) denotes the number of targets incorrectly classified as background.
Precision P represents the proportion of correctly classified positive samples among all predicted positive samples, reflecting the model’s accurate classification capability, and its calculation formula is as follows equation (7).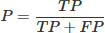 (7)
(7)
Recall R represents the proportion of correctly predicted positive samples to the total number of actual positive samples, reflecting the model’s comprehensive target detection capability, and can be used to measure the missing detection rate of the model in target recognition tasks. Its calculation formula is as follows equation (8).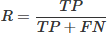 (8)
(8)
The mean Average Precision (mAP) is the average precision of the model for all detected targets [22], which reflects the model’s ability to generate prediction boxes with overlapping regions matching the labels. A higher value of this metric indicates a better detection performance of the model for targets of different categories, and its calculation formula is as follows equation (9).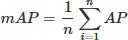 (9)
(9)
where n denotes the number of categories for average precision calculation. In the UAV detection task of this study, n = 1. mAP50 represents the mean average precision when the Intersection over Union threshold is set to 50%; mAP50−95 refers to the metric obtained by gradually adjusting the IoU threshold from 50% to 95% with a step size of 5% and averaging the 10 average precision values obtained within this interval.
The model size (Model Size) is used to evaluate the complexity of the model. Generally speaking, the smaller the model size, the less computing power it requires and the lower the hardware performance requirements, making it easier to deploy on low-end devices.
3.3 Ablation experiments
On the self-built infrared thermal imaging dataset, performance verification was conducted for the enhancement modules of the YOLO-KMM model [23]. Table 1 compares the baseline BASE model with its improved versions integrated with different modules (C2KD, C3K2-MU). The baseline BASE model achieves a mAP50 of 80.4% and a mere mAP50−95 of 42.5% on this dataset, with Precision (P) and Recall (R) reaching 86.9% and 71.4% respectively. After introducing the C2KD module, the model’s mAP50 increases to 82.8%, mAP50−95 rises to 45.3%, P synchronously climbs to 91.9%, and R slightly improves to 72.3%. By further stacking the C3K2-MU module, the mAP50 exceeds 84.1%, mAP50−95 grows to 47.2%, while P and R reach 92.6% and 72.8% respectively. The final YOLO-KMM model integrating all modules achieves the optimal performance: mAP50 hits 88.2%, mAP50−95 increases to 48.4%, with P and R reaching 94.0% and 74.3% respectively. In addition, the prediction heatmaps of different model versions reveal that: the BASE model has weak heatmap focusing ability and low confidence for some targets; after adding the C2KD module, the heatmap focuses more on target regions and the confidence scores are significantly improved, indicating that this module enhances the model’s target recognition and focusing capability. With the C3K2-MU module stacked, the target localization accuracy of the heatmap is further improved and the confidence distribution is more stable, verifying the module’s optimization effect on localization accuracy. The heatmap of YOLO-KMM presents the clearest target boundaries and the highest confidence, confirming the effectiveness of all enhancement modules in improving the model’s detection performance, Figure 8 shows the improvement effects of each module.
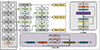 |
Figure 4 Network structure diagram of the improved YOLO-KMM model. |
Ablation experiment results of YOLO-KMM model.
3.4 Performance comparison
On the self-built dataset, comparative experiments were conducted between the proposed YOLO-KMM model and mainstream YOLO series models [24–26] to verify its performance advantages, as shown in Figure 9, the results of each comparison model are presented, and the core indicators of each model are presented in Table 2. Among them, the YOLO-KMM model achieved outstanding detection performance: The Figures 10 and 11 provide a detailed comparison of FPS and mAP50 across different models, its mAP50 reached 88.2%, which was 7.8% points higher than that of the same-level YOLOv11 (80.4%). Meanwhile, the inference frame rate (FPS) of YOLO-KMM reached 246.18, with a single inference time of only about 4.06 ms, achieving a good balance between detection accuracy and real-time performance. In terms of the balance between precision and recall, the precision of YOLO-KMM reached 94.0% and the recall was 74.3%. Compared with YOLOv11 (precision 86.9%, recall 71.4%) [27], both detection accuracy and target coverage were significantly optimized. It can also be seen from the indicator distribution that the number of parameters (2.3 M) and computation (5.4 GFLOPs) of YOLO-KMM were at a low level, indicating smaller computation and parameter scale. These results show that the optimization strategies introduced in YOLO-KMM effectively enhance the feature extraction and target recognition capabilities on the premise of controlling the model scale and computing cost. Its characteristics of high precision, lightweight and fast speed make it more suitable for deployment scenarios with limited computing resources such as UAV inspection and embedded devices [28], and also prove the adaptability of the constructed dataset.
 |
Figure 5 C2KD feature enhancement module fused with token statistics self-attention for ultra-small target weak feature enhancement and background noise suppression. |
Performance comparison of different models.
 |
Figure 6 MU bottleneck block structure integrated with depthwise separable convolution for nonlinear feature capture and computational complexity reduction of infrared small targets. |
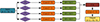 |
Figure 7 Constraint unit for lightweight deployment: Balancing computational efficiency and feature representation capability of the YOLO-KMM model. |
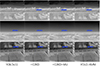 |
Figure 8 The following heatmap diagrams figures illustrate the YOLOv11 prediction results and other improve modules. |
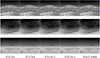 |
Figure 9 Visual comparisons of some YOLO methods and our YOLO-KMM. |
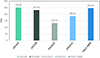 |
Figure 10 FPS comparison of different models. |
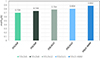 |
Figure 11 Comparison of mean average precision at 50% intersection over union (mAP50) among different models. |
The lightweight architecture of YOLO-KMM and efficient inference speed strongly indicate its feasibility for deployment on resource- constrained platforms such as NVIDIA Jetson series devices. The optimization strategies in the C3K2-MU module, including channel pruning and depthwise separable convolutions, are specifically designed to facilitate efficient execution on embedded systems. The computational complexity ratio of C=N demonstrates that TSSA achieves approximately 80–95% complexity reduction compared to standard self-attention, which directly translates to reduced memory footprint on edge devices. While comprehensive performance quantification on specific edge platforms remains a valuable direction for future work, the model’s design principles align with successful lightweight deployment strategies documented in recent embedded AI research.
4 Conclusion
Aiming at the practical challenges of air-to-air infrared small UAV detection, including the lack of dedicated datasets, sparse ultra-small target features, and limited deployment resources of on-board platforms, this study completes the construction of the SIM–AIR dataset and the design of the YOLO–KMM model, and forms a complete technical solution of “dedicated dataset and lightweight detection model”. This section summarizes the main research results of the study, analyzes the existing limitations, and further proposes the future research directions for the optimization of the dataset and model.
The construction of the SIM–AIR dataset fills the gap of dedicated infrared datasets for air-to-air scenarios. It includes 3993 accurately annotated images, four typical weather conditions, 99.7% ultra-small target samples, and complex scenarios such as “reverse contrast” in snowy days and low signal-to-noise ratio (SNR) in hazy days, which fully simulates the arduousness of actual air-to-air detection. It not only provides an accurately adapted experimental platform for this study but also offers valuable high-quality data support for subsequent research in related fields [29, 30]. Experimental results fully verify the practicality of the SIM–AIR dataset and the adaptability of the YOLO–KMM model: on this dataset, the  of YOLO–KMM reaches 88.2%, which is 7.8% points higher than that of the baseline model; the precision and recall are increased to 94.0% and 74.3% respectively; the small target miss rate is significantly reduced by 12.5%, fully proving the effectiveness of the C2KD module in enhancing weak feature extraction of small targets and suppressing background interference. Meanwhile, the model parameters are controlled at 2.3 M, the computation amount is only 5.4 GFLOPs, and the inference frame rate reaches 246.18 FPS. Compared with mainstream models such as YOLOv5, YOLOv8, YOLOv11, and YOLOv12, it shows the optimal balance performance of “accuracy-speed-complexity”, especially in complex weather scenarios such as hazy and snowy days, with significant advantages in detection robustness.
Compared with existing research, the YOLO–KMM model, through targeted module design, is more adaptable to the ultra-small target, low SNR characteristics of the SIM–AIR dataset and the deployment requirements of resource-constrained scenarios. Its lightweight, high-precision, and fast-speed characteristics endow it with broad application prospects in practical applications such as UAV air-to-air inspection and real-time detection on embedded devices [31–34]. However, this study still has certain limitations: the detection performance of the model in extreme occlusion and multi-target overlap scenarios in the SIM–AIR dataset needs further improvement; at the same time, the target categories of the dataset only cover a single type of small UAV, and its generalization can be further expanded. Future research can be carried out in the following directions. First, expand the SIM-AIR dataset by systematically adding samples with extreme occlusion – defined as target obscuration exceeding 50% of the bounding box area – along with multi-target overlap scenarios and diverse UAV platforms, which will improve the model’s generalization capability [35]. Second, explore multi-modal sensor fusion strategies, combining early fusion approaches that integrate raw radar signals with infrared features at the feature extraction stage, and late fusion methods that merge independent infrared-based detection with radar trajectory estimation at the decision level, to substantially enhance robustness in adverse weather conditions [36–38]. Third, implement advanced model compression techniques including quantization and structured pruning to further reduce computational overhead for deployment on edge devices [39].
Funding
This research did not receive any specific grant from funding agencies in the public, commercial, or not-for-profit sectors.
Conflicts of interest
The authors declare that they have no competing interests.
Data availability statement
The dataset generated and analyzed during the current study will be made publicly available upon acceptance of the manuscript.
Author contribution statement
All authors take part in the discussion of the work described in this paper. These authors contributed equally to this work.
Ethics approval
This study does not involve human participants or animals, and therefore ethical approval is not required.
Informed consent
Informed consent is not applicable, as this study does not involve human subjects.
Acknowledgments
The authors would like to thank the anonymous reviewers for their valuable comments and suggestions that helped improve the quality of manuscript.
References
- Zhang T., Wu H., Liu Y., Li L., Peng J., Infrared small target detection based on local contrast measure and gradient minimization, Infrared Phys. Technol. 105, 103260 (2020). https://doi.org/10.1016/j.infrared.2020.103260. [Google Scholar]
- Dai Y., Wu Y., Zhou F., Barnard K., A survey of infrared small target detection, IEEE Trans. Geosci. Remote Sens. 60, 1-15 (2022). https://doi.org/10.1109/TGRS.2022.3173446. [CrossRef] [Google Scholar]
- Jocher G., Chaurasia A., Qiu J., Ultralytics YOLOv8, GitHub Repository (2023). https://github.com/ultralytics/ultralytics [Google Scholar]
- Bochkovskiy A., Wang C.-Y., Liao H.-Y.M., YOLOv4: Optimal speed and accuracy of object detection, arXiv:2004.10934 (2020). https://doi.org/10.48550/arXiv.2004.10934. [Google Scholar]
- Jocher G. et al., YOLOv5: A state-of-the-art real-time object detection system, GitHub Repository (2020). https://github.com/ultralytics/yolov5 [Google Scholar]
- Wang C.-Y., Bochkovskiy A., Liao H.-Y.M., YOLOv7: Trainable bag-of-freebies sets new state-of-the-art for real-time object detectors, Proc. IEEE/CVF Conf. Comput. Vis. Pattern Recognit. 7464–7475 (2023). https://doi.org/10.1109/CVPR52733.2023.00721. [Google Scholar]
- Li C. et al., YOLOv6: A single-stage object detection framework for industrial applications, arXiv:2209.02976 (2022). https://doi.org/10.48550/arXiv.2209.02976 [Google Scholar]
- Terven J., Cordova-Esparza D., A comprehensive review of YOLO: From YOLOv1 to YOLOv8 and beyond, arXiv:2304.00501 (2023). https://doi.org/10.48550/arXiv.2304.00501. [Google Scholar]
- Vaswani A. et al., Attention is all you need, Adv. Neural Inf. Process. Syst. 30, 5998–6008 (2017). https://doi.org/10.48550/arXiv.1706.03762. [Google Scholar]
- Woo S., Park J., Lee J.-Y., Kweon I.S., CBAM: Convolutional block attention module, Proc. Eur. Conf. Comput. Vis., 3–19 (2018). https://doi.org/10.1007/978-3-030-01234-2_1. [Google Scholar]
- Hu J., Shen L., Sun G., Squeeze-and-excitation networks, Proc. IEEE Conf. Comput. Vis. Pattern Recognit., 7132–7141 (2018). https://doi.org/10.1109/CVPR.2018.00745. [Google Scholar]
- Howard A.G. et al., MobileNets: Efficient convolutional neural networks for mobile vision applications, arXiv:1704.04861 (2017). https://doi.org/10.48550/arXiv.1704.04861. [Google Scholar]
- Zhang X., Zhou X., Lin M., Sun J., ShuffleNet: An extremely efficient convolutional neural network for mobile devices, Proc. IEEE Conf. Comput. Vis. Pattern Recognit., 6848–6856 (2018). https://doi.org/10.1109/CVPR.2018.00716. [Google Scholar]
- Sandler M., Howard A., Zhu M., Zhmoginov A., Chen L.-C., MobileNetV2: Inverted residuals and linear bottlenecks, Proc. IEEE Conf. Comput. Vis. Pattern Recognit., 4510–4520 (2018). https://doi.org/10.1109/CVPR.2018.00474. [Google Scholar]
- Tan M., Le Q., EfficientNet: Rethinking model scaling for convolutional neural networks, Proc. Int. Conf. Mach. Learn. 97, 6105–6114 (2019). https://doi.org/10.48550/arXiv.1905.11946 [Google Scholar]
- Liu S., Qi L., Qin H., Shi J., Jia J., Path aggregation network for instance segmentation, Proc. IEEE Conf. Comput. Vis. Pattern Recognit., 8759–8768 (2018). https://doi.org/10.1109/CVPR.2018.00913. [Google Scholar]
- Lin T.-Y., Dollár P., Girshick R., He K., Hariharan B., Belongie S., Feature pyramid networks for object detection, Proc. IEEE Conf. Comput. Vis. Pattern Recognit., 2117–2125 (2017). https://doi.org/10.1109/CVPR.2017.106. [Google Scholar]
- Du D. et al., VisDrone-DET2019: The vision meets drone object detection in image challenge results, Proc. IEEE/CVF Int. Conf. Comput. Vis. Workshops, 0–0 (2019). https://doi.org/10.1109/ICCVW.2019.00400. [Google Scholar]
- Zhu P. et al., Detection and tracking meet drones challenge, IEEE Trans. Pattern Anal. Mach. Intell. 44, 7380–7399 (2021). https://doi.org/10.1109/TPAMI.2021.3119563 [Google Scholar]
- Cao Y., Chen S., Zhang Y., Zhang Q., LWIR vs. MWIR vs. SWIR: A comparative study of infrared imaging for UAV-based object detection, Proc. SPIE 11740, 117400K (2021). https://doi.org/10.1117/12.2588235 [Google Scholar]
- Everingham M., Van Gool L., Williams C.K.I., Winn J., Zisserman A., The Pascal visual object classes (VOC) challenge, Int. J. Comput. Vis. 88, 303–338 (2010). https://doi.org/10.1007/s11263-009-0275-4 [CrossRef] [Google Scholar]
- Lin T.-Y. et al., Microsoft COCO: Common objects in context, Proc. Eur. Conf. Comput. Vis., 740–755 (2014). https://doi.org/10.1007/978-3-319-10602-1_48. [Google Scholar]
- Rezatofighi H. et al., Generalized intersection over union: A metric and a loss for bounding box regression, Proc. IEEE/CVF Conf. Comput. Vis. Pattern Recognit., 658–666 (2019). https://doi.org/10.1109/CVPR.2019.00075 [Google Scholar]
- Redmon J., Farhadi A., YOLOv3: An incremental improvement arXiv:1804.02767(2018). https://doi.org/10.48550/arXiv.1804.02767 [Google Scholar]
- Girshick R., Donahue J., Darrell T., Malik J., Rich feature hierarchies for accurate object detection and semantic segmentation, Proc. IEEE Conf. Comput. Vis. Pattern Recognit., 580–587 (2014). https://doi.org/10.1109/CVPR.2014.81. [Google Scholar]
- Ren S., He K., Girshick R., Sun J., Faster R-CNN: Towards real-time object detection with region proposal networks, Adv. Neural Inf. Process. Syst. 28 (2015). https://doi.org/10.48550/arXiv.1506.01497. [Google Scholar]
- Liu W. et al., SSD: Single shot multibox detector, Proc. Eur. Conf. Comput. Vis., 21–37 (2016). https://doi.org/10.1007/978-3-319-46448-0_2. [Google Scholar]
- Deng J. et al., ImageNet: A large-scale hierarchical image database, Proc. IEEE Conf. Comput. Vis. Pattern Recognit., 248–255 (2009). https://doi.org/10.1109/CVPR.2009.5206848. [Google Scholar]
- Jiang C., Ren H., Ye X., Zhu J., Zeng H., Yang N., Sun M., Ren X., Huo H., Object detection from UAV thermal infrared images and videos using YOLO models, Int. J. Appl. Earth Obs. Geoinf. 112, 102912 (2022). https://doi.org/10.1016/J.JAG.2022.102912. [Google Scholar]
- Andraši P., Radišić T., Muštra M., Ivošević J., Night-time detection of UAVs using thermal infrared camera, Transp. Res. Procedia 28, 183 (2017). https://doi.org/10.1016/j.trpro.2017.12.184. [Google Scholar]
- Mittal P., A comprehensive survey of deep learning-based lightweight object detection models for edge devices, Artif. Intell. Rev. 57, 242 (2024). https://doi.org/10.1007/S10462-024-10877-1. [Google Scholar]
- Fan Q., Li Y., Deveci M., Zhong K., Kadry S., LUD-YOLO: A novel lightweight object detection network for unmanned aerial vehicle, Inf. Sci. 686, 121366 (2025). https://doi.org/10.1016/J.INS.2024.121366. [Google Scholar]
- Han B.G., Lee J.G., Lim K.T., Choi D.H., Design of a scalable and fast YOLO for edge-computing devices, Sensors 20, 6779 (2020). https://doi.org/10.3390/S20236779. [CrossRef] [Google Scholar]
- Li J., Ye J., Edge-YOLO: Lightweight infrared object detection method deployed on edge devices, Appl. Sci. 13, 4402 (2023). https://doi.org/10.3390/APP13074402. [Google Scholar]
- Zhang R., Li H., Duan K., You S., Liu K., Wang F., Hu Y., Automatic detection of earthquake-damaged buildings by integrating UAV oblique photography and infrared thermal imaging, Remote Sens. 12, 2621 (2020). https://doi.org/10.3390/rs12162621. [Google Scholar]
- He K., Zhang X., Ren S., Sun J., Deep residual learning for image recognition, Proc. IEEE Conf. Comput. Vis. Pattern Recognit., 770–778 (2016). https://doi.org/10.1109/CVPR.2016.90. [Google Scholar]
- Wu D., Cao L., Zhou P., Li N., Li Y., Wang D., Infrared small-target detection based on radiation characteristics with a multimodal feature fusion network, Remote Sens. 14, 3570 (2022). https://doi.org/10.3390/RS14153570. [Google Scholar]
- Liu Z., Zou Y., Hu Z., Xue H., Li M., Rao B., Research on multi-modal fusion detection method for low-slow-small uavs based on deep learning, Drones 9, 852 (2025). https://doi.org/10.3390/DRONES9120852. [Google Scholar]
- Iandola F.N. et al., SqueezeNet: AlexNet-level accuracy with 50x fewer parameters and <0.5MB model size, arXiv:1602.07360 (2016). https://doi.org/10.48550/arXiv.1602.07360. [Google Scholar]
All Tables
All Figures
|
Figure 1 Sample images from the dataset. |
| In the text | |
|
Figure 2 Proportion of the dataset under different weather conditions. |
| In the text | |
|
Figure 3 Target and background average gray level comparison. |
| In the text | |
|
Figure 4 Network structure diagram of the improved YOLO-KMM model. |
| In the text | |
|
Figure 5 C2KD feature enhancement module fused with token statistics self-attention for ultra-small target weak feature enhancement and background noise suppression. |
| In the text | |
|
Figure 6 MU bottleneck block structure integrated with depthwise separable convolution for nonlinear feature capture and computational complexity reduction of infrared small targets. |
| In the text | |
|
Figure 7 Constraint unit for lightweight deployment: Balancing computational efficiency and feature representation capability of the YOLO-KMM model. |
| In the text | |
|
Figure 8 The following heatmap diagrams figures illustrate the YOLOv11 prediction results and other improve modules. |
| In the text | |
|
Figure 9 Visual comparisons of some YOLO methods and our YOLO-KMM. |
| In the text | |
|
Figure 10 FPS comparison of different models. |
| In the text | |
|
Figure 11 Comparison of mean average precision at 50% intersection over union (mAP50) among different models. |
| In the text | |
Current usage metrics show cumulative count of Article Views (full-text article views including HTML views, PDF and ePub downloads, according to the available data) and Abstracts Views on Vision4Press platform.
Data correspond to usage on the plateform after 2015. The current usage metrics is available 48-96 hours after online publication and is updated daily on week days.
Initial download of the metrics may take a while.