| Issue |
J. Eur. Opt. Society-Rapid Publ.
Volume 22, Number 1, 2026
EOSAM 2025
|
|
|---|---|---|
| Article Number | 11 | |
| Number of page(s) | 4 | |
| DOI | https://doi.org/10.1051/jeos/2026007 | |
| Published online | 23 February 2026 | |
Short Communication
Comparison of seismic records obtained by distributed acoustic sensing and ocean bottom seismometers
1
INESC TEC – Institute for Systems and Computer Engineering, Technology and Science, Rua do Campo Alegre, 687, 4150-179 Porto, Portugal
2
Instituto Dom Luiz, University of Lisbon, 1749-016 Lisbon, Portugal
3
Agência Regional para o Desenvolvimento da Investigação, Tecnologia e Inovação, Funchal, Portugal
4
Instituto de Óptica “Daza de Valdés” IO-CSIC, C/Serrano 121, 28006 Madrid, Spain
5
Instituto Português do Mar e da Atmosfera, Rua C ao aeroporto, 1749-077 Lisbon, Portugal
6
IT Instituto de Telecomunicações Lisboa, Campus Alameda, Torre Norte - Piso 10, Av. Rovisco Pais, 1, 1049 - 001 Lisboa, Portugal
7
ISEL Instituto Superior de Engenharia de Lisboa, Rua Conselheiro Emídio Navarro 1, 1959-007 Lisboa, Portugal
* Corresponding author: This email address is being protected from spambots. You need JavaScript enabled to view it.
Received:
3
December
2025
Accepted:
23
January
2026
Abstract
This work presents an experimental framework for offshore seismic monitoring that combines Distributed Acoustic Sensing (DAS) with ocean-bottom seismometers (OBS). The study was conducted in the Azores region – Faial, where an HDAS interrogator prototype was connected to dark fiber submarine fiber-optic cable, complemented by the installation of two Ocean Bottom Seismometers (OBS) for calibration and validation of DAS technology. The main objective is to demonstrate that seismic observations obtained by DAS from seafloor cables can provide essential information similar to OBS and particularly in areas where land-based monitoring stations are limited.
Key words: Distributed acoustic sensing / Submarine cable / Ocean-bottom seismometers / Sismology
© The Author(s), published by EDP Sciences, 2026
 This is an Open Access article distributed under the terms of the Creative Commons Attribution License (https://creativecommons.org/licenses/by/4.0), which permits unrestricted use, distribution, and reproduction in any medium, provided the original work is properly cited.
1 Introduction
Distributed Acoustic Sensing (DAS) enables fiber-optic cables to be used as dense, distributed arrays of acoustic sensors via a simple OTDR-based approach, offering clear advantages in marine environments where conventional instrumentation is difficult to deploy [1]. Because the fiber acts simultaneously as the sensing element and the transmission medium, and its optical properties respond to external disturbances, careful validation and calibration are required for quantitative applications such as earthquake magnitude estimation [2]. DAS has been successfully used for detecting and locating earthquakes, imaging subsurface structure, and monitoring natural hazards, with recent studies extending its use to hypocenter estimation, magnitude proxies, and rupture characterization from strain/strain-rate data [3]. Typical sensing ranges lie between ~30–40 km and ~100 km, limited by fiber attenuation and Rayleigh backscatter degradation [4]. Distributed Raman amplification can extend the range beyond ~100 km [5], and with the use of pulse compression it can reach distances of >150 km [6]. Ocean Bottom Seismometers (OBS) are autonomous platforms that record ground motion on the seafloor, enabling offshore seismicity monitoring and lithospheric studies in areas lacking land networks. They typically integrate a 3-component broadband seismometer and a hydrophone, improving the separation of seismic, hydrodynamic, and acoustic signals [7]. In this work, we describe the experimental framework for monitoring using both DAS and OBS. We then summarize the main properties of the DAS and OBS datasets and discuss preliminary earthquake analyses as recorded by both systems. Finally, we demonstrate that in regions such as the Azores – Faial where seismic monitoring is largely restricted to land stations – DAS observations from offshore cables can provide valuable information for real-time operations and for deferred-time investigations of offshore seismicity.
2 Installation of the HDAS and OBS on the submarine cable
The submarine cable used in this study comprises three fiber pairs of standard single-mode optical fiber (SMF-28). The specified attenuation is 0.12 dB/km at 1550 nm. The cable is 170 km long, unpowered, and contains no repeaters. It was laid mostly on the ocean floor, with protection levels that vary with seafloor depth; the depth increases rapidly away from the coastline. In Figure 1, the monitored cable by HDAS is shown as a thick white line. The two OBS are shown as red dots. The three land stations are shown as green triangles. The epicentre location is highlighted with a yellow star. DAS data was collected on a dark fiber from an unused telecom fiber pair. At the ALTICE cable-landing station, we connected a HiFi Distributed Acoustic Sensor (HDAS) to the Fibroglobal terminal equipment. The HDAS is a chirped-pulse ϕ-OTDR interrogator prototype developed by UAH and CSIC [8]. Figure 1 presents the Experimental setting in Faial Azores. The monitored cable by HDAS is shown in thick white. The two OBS are shown in red. The land stations are shown by green triangles.
An FC/APC connector was used to minimize back-reflections at the interface with the submarine cable, preventing signal degradation and potential damage to the HDAS photodetector. The interrogator is identical to the CP-DAS system described in [9], based on ϕ-OTDR using chirped optical pulses, a patented technology. A patented Raman-amplification range-extension module increases the sensing reach from 35 to 40 km to up to 70 km per fiber access. The manufacturer specifies a strain resolution better than 5 nε (nanostrain). In this experiment, the HDAS interrogated ~50 km of cable with a 10 m gauge length and 10 m spatial sampling, yielding 4,992 channels, with an acoustic sampling frequency of 1 kHz. The strain time series were later downsampled to 50 Hz, which was sufficient to resolve the seismic signals of interest while reducing data volume. For calibration and validation of the HDAS recordings, the MODAS project deployed two OBS units developed at IDL, advanced seabed instruments designed for long-term offshore monitoring. Each OBS records ground motion with a broadband seismometer and seismic–acoustic signals in the water column with a hydrophone. The deployment sites (Fig. 1) lie approximately 500 m from the submarine cable, allowing direct comparison between OBS and DAS measurements. Accurate timing for joint analyses with HDAS was ensured by synchronizing the OBS internal clock at the start and end of the experiment. The seismometers recorded leveled ground-velocity data on the three components (N, E, Z) at 250 Hz, while the hydrophone channel was sampled at 100 Hz. Each OBS includes an HTI-04-PCA/ULF hydrophone (100 s–8 kHz), a Güralp Certis broadband seismometer with a 120-s corner period, and a Güralp Certimus data logger. Accurate timing for joint analyses with HDAS was ensured by synchronizing the OBS internal clock at the start and end of the experiment.
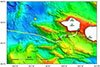 |
Fig. 1 Experiment setting in Faial, Azores. The monitored cable by HDAS is shown in thick white. The two OBS are shown in red. The land stations are shown by green triangles. The epicenter location is highlighted with a yellow star. |
3 Preliminary analysis of earthquake data
The DAS and OBS recorded several earthquakes over a period of five months. Figure 2 shows one of these earthquakes, recorded at around 12:36 a.m. on September 24, 2024, with a magnitude of 2.7 on the Richter scale and an epicenter located 20 km from the submarine cable, according to information provided by Instituto Português do Mar e Atmosfera (IPMA). However, we can also observe other energy signals that have not yet been identified. By comparing the two OBS locations, we see that their responses are similar, with a time delay that is expected due to the relative positioning of the OBS units. During the five-month interval in which the HDAS and the OBS were recording simultaneously, the IPMA network – comprising land-based stations on the neighboring islands (see Fig. 1 for locations) – detected 229 local and regional earthquakes. To quantitatively assess the network’s sensitivity and detection threshold in this area, we examined the relationship between event magnitude and the minimum distance to the submarine cable. Specifically, by plotting magnitude as a function of the closest distance to the cable (see Fig. 3), we can evaluate how sensitivity decreases with increasing source–receiver separation. This allowed us to delineate the magnitude–distance envelope below which events are no longer consistently recorded. This provides a useful baseline for comparing the performance of DAS/HDAS and OBS observations with that of the land network, particularly for offshore seismicity where terrestrial instrumental coverage is inherently limited.
A sensitivity-threshold function for the land network was derived (red curve in Fig. 3a), empirically outlining the magnitude–distance range in which onshore stations reliably detect earthquakes; events falling below this curve are increasingly likely to go undetected. In parallel, HDAS recordings were examined for 229 events near the OBS sites (LOC1 near MAD01 and LOC2 near MAD02), where cross-method comparison is strongest. Each event’s HDAS signal quality was classified into five categories: Very good (clear P and S waves on both cable sections), Good (at least one identifiable P wave plus clear S waves), Fair (well-defined S waves but no clear P wave), Poor (weak, poorly defined S waves), and None (no recognizable seismic signal).This classification converts the qualitative inspection of the recordings into a metric that is comparable across events, highlighting the influence of source–receiver distance and magnitude on HDAS detectability. The results are displayed in Figure 3b as a function of distance and magnitude and are compared with the proposed reference threshold law. This comparison is important because it shows the extent to which HDAS matches (or exceeds) the sensitivity of the land network, particularly for offshore seismicity, where DAS is expected to offer clear advantages due to the proximity of the cable to the seismic sources.
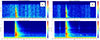 |
Fig. 2 Spectrogram comparison results of an earthquake with a magnitude of 2.7 read in a DAS (top) and on the two OBS (bottom) in LOC1 and MAD01 (a) and LOC2 and MAD02 (b). |
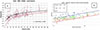 |
Fig. 3 a) Earthquake magnitude versus distance for events detected by land stations during the HDAS–OBS overlap. The black line shows the best-fit logarithmic curve, and the red line indicates the sensitivity threshold. b) Magnitude versus distance for the 229 earthquakes examined for HDAS recordings. Colors represent waveform quality (see text). The red line shows the proposed logarithmic reference threshold law M*. In blue we show M*+1 in magnitude, which is close to the threshold for good-quality P-waves recorded by HDAS. |
4 Conclusion
Over five months, the DAS and OBS recorded several earthquakes, including a magnitude 2.7 event that fell on Faial Island. In addition to these earthquakes, other unidentified energy signals were detected. The two OBS stations show similar responses, with a time delay expected due to their spatial separation. During the same period, the IPMA network detected 229 local and regional earthquakes. The relationship between event magnitude and the minimum distance to the submarine cable was analyzed to assess the sensitivity and detection threshold in the area. This analysis defines the magnitude–distance limit beyond which events are no longer consistently recorded, providing a reference for comparing the performance of DAS/HDAS and OBS observations with that of the land-based network, especially for offshore seismicity.
Funding
This work is supported by the Portuguese Fundação para a Ciência e Tecnologia, FCT, I.P./MCTES through national funds (PIDDAC): UID/50019/2025 and LA/P/0068/2020 (https://doi.org/10.54499/LA/P/0068/2020), by the MODAS project 2022.02359.PTDC, and by EC project SUBMERSE project HORIZON-INFRA-2022-TECH-01-101095055. HFM acknowledges financial support from the MCIN/AEI/10.13039/501100011033 and European Union «NextGenerationEU» /PRTR under grants RYC2021-035009-I, CPP2022-009772, PID2024-162301OA-C22, CPP2024-011822. This work is co-funded by Component 5 – Capitalization and Business Innovation, integrated in the Resilience Dimension of the Recovery and Resilience Plan within the scope of the Recovery and Resilience Mechanism (MRR) of the European Union (EU), framed in the Next Generation EU, for the period 2021 – 2026, within project OBSERVA, with reference 2024.07610.IACDC (https://doi.org/10.54499/2024.07610.IACDC).
Conflicts of interest
The authors have nothing to disclose.
Data availability statement
Data are available upon reasonable request at the indicated e-mail.
Author contribution statement
Conceptualization, L. Matias and O. Frazão; Methodology, C. Corela and F. Carrilho; Software, A. Loureiro and R. Sousa; Validation, L. Matias and M. Niehus; Formal Analysis, H. Martins; Investigation, C. Corela, A. Loureiro, P. Robalinho, F. Carrilho and R. Omira; Writing – Original Draft Preparation, O. Frazão and S. Silva; Writing – Review & Editing, L. Matias, M. Niehus and O. Frazão; Visualization, H. Martins; Supervision, L. Matias; Project Administration, L. Matias.
References
- Juarez JC, Maier EW, Choi KN, Taylor HF, Distributed fiber-optic intrusion sensor system using phase-sensitive OTDR (ϕ-OTDR), J. Lightwave Technol. 23(6), 2081–2087 (2005). https://doi.org/10.1109/JLT.2005.849924. [Google Scholar]
- Matthaiou I, Masoudi A, Araki E, Kodaira S, Modafferi S, Brambilla G, Classification of images derived from submarine fibre optic sensing: detecting broadband seismic activity from hydroacoustic signals, Geophys. J. Int. 240(1), 483–501 (2025). https://doi.org/10.1093/gji/ggae400. [Google Scholar]
- Taha BA, Addie AJ, Haider AJ, Osman SA, Ramli MZ, Arsad N, A review of seismic detection using fiber optic distributed acoustic sensing: from telecommunication cables to earthquake sensors, Nat. Hazards 121, 13927–13959 (2025). https://doi.org/10.1007/s11069-025-07370-5. [Google Scholar]
- Zinsou R, Liu X, Wang Y, Zhang J, Wang Y, Jin B, Recent progress in the performance enhancement of phase-sensitive OTDR vibration sensing systems, Sensors 19(7), 1709 (2019). https://doi.org/10.3390/s19071709. [Google Scholar]
- Martins HF, Martín-López S, Corredera P, Filograno ML, Frazão O, Gonzalez-Herráez M, Phase-sensitive optical time domain reflectometer assisted by first-order Raman amplification for distributed vibration sensing over >100 km, J. Lightwave Technol. 32(8), 1510–1518 (2014). https://doi.org/10.1109/JLT.2014.2308354. [Google Scholar]
- Waagaard OH, Rønnekleiv E, Haukanes A, Stabo-Eeg F, Thingbø D, Forbord S, Aasen SE, Brenne JK, “Real-time low noise distributed acoustic sensing in 171 km low loss fiber,” OSA Continuum 4(2), 688–701 (2021). [Google Scholar]
- Mànuel A, Roset X, Rio JD, Toma DM, Carreras N, Panahi SS, Garcia-Benadí A, Owen, T, Cadena J, Ocean bottom seismometer: design and test of a measurement system for marine seismology, Sensors 12(3), 3693–3719 (2012). https://doi.org/10.3390/s120303693. [Google Scholar]
- Pastor-Graells J, Martins HF, Garcia-Ruiz A, Martin-Lopez S, Gonzalez-Herraez M, Single-shot distributed temperature and strain tracking using direct detection phase-sensitive OTDR with chirped pulses, Opt. Express 24(12), 13121–13133 (2016). https://doi.org/10.1364/OE.24.013121. [Google Scholar]
All Figures
|
Fig. 1 Experiment setting in Faial, Azores. The monitored cable by HDAS is shown in thick white. The two OBS are shown in red. The land stations are shown by green triangles. The epicenter location is highlighted with a yellow star. |
| In the text | |
|
Fig. 2 Spectrogram comparison results of an earthquake with a magnitude of 2.7 read in a DAS (top) and on the two OBS (bottom) in LOC1 and MAD01 (a) and LOC2 and MAD02 (b). |
| In the text | |
|
Fig. 3 a) Earthquake magnitude versus distance for events detected by land stations during the HDAS–OBS overlap. The black line shows the best-fit logarithmic curve, and the red line indicates the sensitivity threshold. b) Magnitude versus distance for the 229 earthquakes examined for HDAS recordings. Colors represent waveform quality (see text). The red line shows the proposed logarithmic reference threshold law M*. In blue we show M*+1 in magnitude, which is close to the threshold for good-quality P-waves recorded by HDAS. |
| In the text | |
Current usage metrics show cumulative count of Article Views (full-text article views including HTML views, PDF and ePub downloads, according to the available data) and Abstracts Views on Vision4Press platform.
Data correspond to usage on the plateform after 2015. The current usage metrics is available 48-96 hours after online publication and is updated daily on week days.
Initial download of the metrics may take a while.