Fig. 3
Download original image
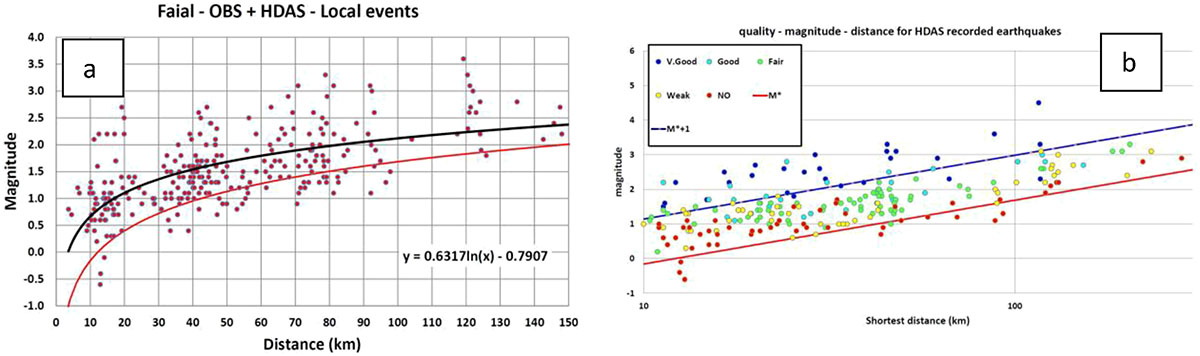
a) Earthquake magnitude versus distance for events detected by land stations during the HDAS–OBS overlap. The black line shows the best-fit logarithmic curve, and the red line indicates the sensitivity threshold. b) Magnitude versus distance for the 229 earthquakes examined for HDAS recordings. Colors represent waveform quality (see text). The red line shows the proposed logarithmic reference threshold law M*. In blue we show M*+1 in magnitude, which is close to the threshold for good-quality P-waves recorded by HDAS.
Current usage metrics show cumulative count of Article Views (full-text article views including HTML views, PDF and ePub downloads, according to the available data) and Abstracts Views on Vision4Press platform.
Data correspond to usage on the plateform after 2015. The current usage metrics is available 48-96 hours after online publication and is updated daily on week days.
Initial download of the metrics may take a while.