Open Access
Figure 9
Download original image
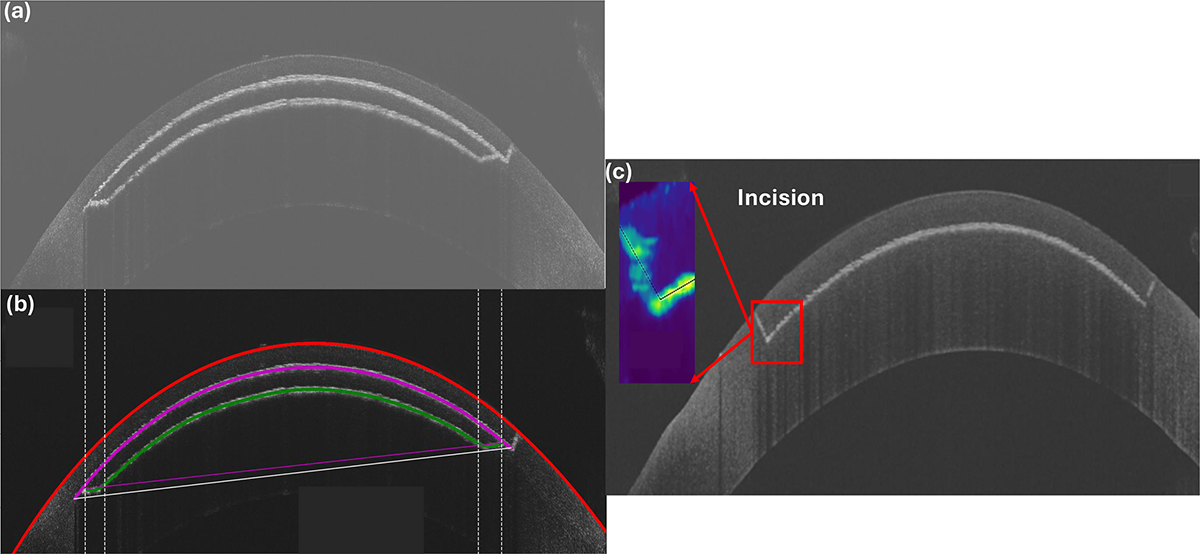
(b) identifies the transition zones of (a), as the regions within the posterior fit curvature alters from convex to concave corresponding to a sign change of the 2nd order gradient. (c) illustrate the hinge angle detection (on flap cuts) using a similar rationale. The black dashed lines illustrate ![]() and
and ![]() to determine θ.
to determine θ.
Current usage metrics show cumulative count of Article Views (full-text article views including HTML views, PDF and ePub downloads, according to the available data) and Abstracts Views on Vision4Press platform.
Data correspond to usage on the plateform after 2015. The current usage metrics is available 48-96 hours after online publication and is updated daily on week days.
Initial download of the metrics may take a while.