Open Access
Figure 9
Download original image
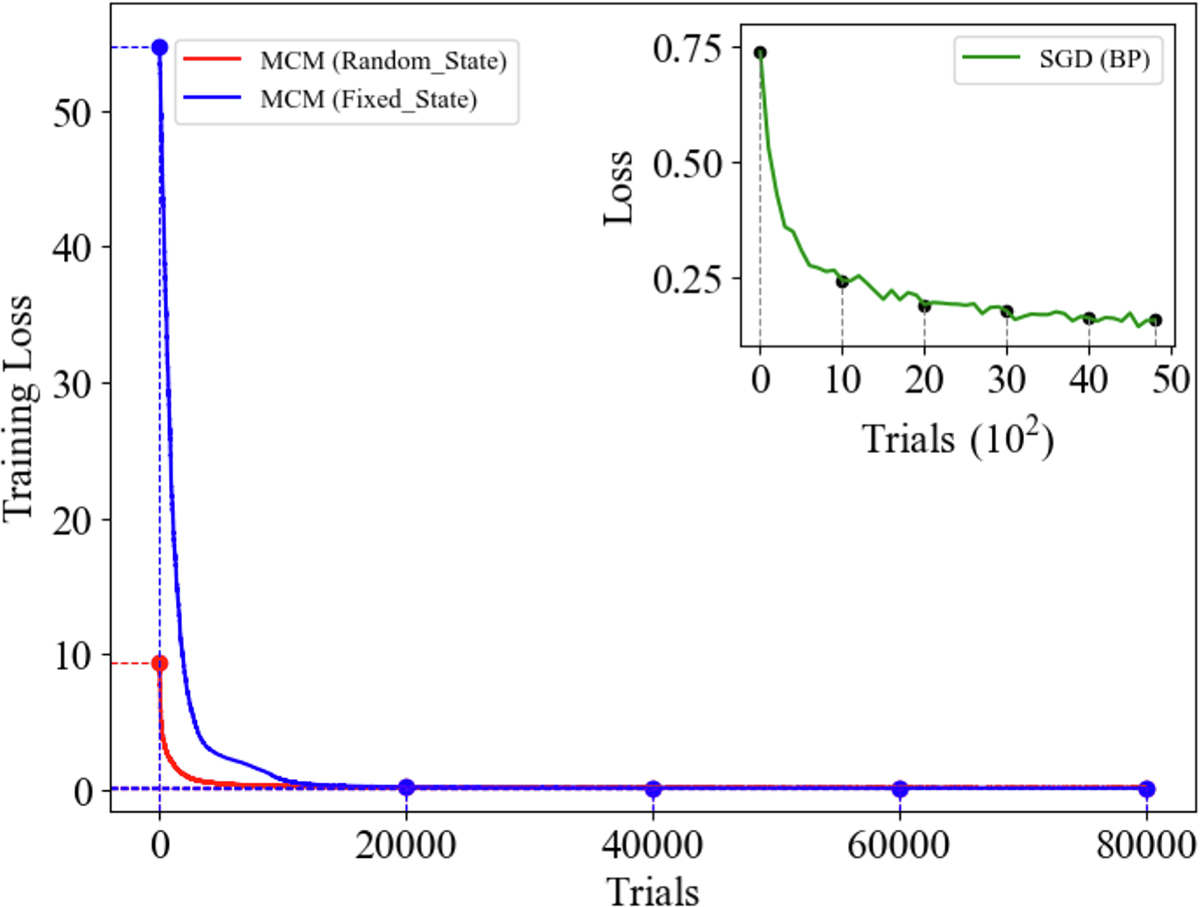
Loss convergence over 80,000 MCM trials for deterministic (blue) and random (red) initializations. Results are compared with a 5,000-trial BP baseline (inset, top-right).
Current usage metrics show cumulative count of Article Views (full-text article views including HTML views, PDF and ePub downloads, according to the available data) and Abstracts Views on Vision4Press platform.
Data correspond to usage on the plateform after 2015. The current usage metrics is available 48-96 hours after online publication and is updated daily on week days.
Initial download of the metrics may take a while.