| Issue |
J. Eur. Opt. Society-Rapid Publ.
Volume 22, Number 1, 2026
EOSAM 2025
|
|
|---|---|---|
| Article Number | 26 | |
| Number of page(s) | 6 | |
| DOI | https://doi.org/10.1051/jeos/2026029 | |
| Published online | 17 April 2026 | |
Review Article
Study of tapered microfibers by line-field confocal optical coherence tomography
Université Paris-Saclay, Institut d’Optique Graduate School, CNRS, Laboratoire Charles Fabry, 91127, Palaiseau, France
* Corresponding author: This email address is being protected from spambots. You need JavaScript enabled to view it.
Received:
19
January
2026
Accepted:
14
March
2026
Abstract
We present for the first time to our knowledge measurements of the evolution of the core and cladding diameters in tapered silica microfibers using LC-OCT. The results could help refine models of propagation of optical modes in tapers.
Key words: Silica microfibers / Optical tapers / Line-field confocal optical coherence tomography / Silica optical fibers
© The Author(s), published by EDP Sciences, 2026
 This is an Open Access article distributed under the terms of the Creative Commons Attribution License (https://creativecommons.org/licenses/by/4.0), which permits unrestricted use, distribution, and reproduction in any medium, provided the original work is properly cited.
1. Introduction and motivations
Optical microfibers are typically produced by tapering standard silica fibers – commonly used in telecommunications – until their diameters become comparable to or smaller than the wavelength of the propagating light. The uniform section of the resulting structure, referred to as the microfiber, is connected to the untapered fiber parts through two conical sections known as tapers (see Fig. 1). These devices have been extensively used for over three decades in both scientific research and engineering, serving as fundamental optical devices that are inherently compatible with all-fiber networks [1]. Owing to their unique properties, microfiber-based technologies have proven to be versatile across a wide range of applications, from fundamental studies to advanced implementations such as quantum information systems [2, 3], remote sensing devices [4], and nonlinear optics in the silica itself [5, 6] or in the surrounding medium via the evanescent field [7, 8].
A key challenge in microfiber fabrication is ensuring the adiabaticity of the taper regions. An adiabatic taper is characterized by a sufficiently small taper angle to suppress coupling between the guided fundamental mode and unwanted higher-order modes, thereby preserving high transmission efficiency of the desired mode. The standard adiabaticity criterion is based on the comparison of two characteristic lengths. The first one is the beat length  between the fundamental LP01 mode and the nearest higher-order mode with the same azimuthal symmetry, namely the LP02 mode. This beat length is obtained from the difference between the longitudinal propagation constants of the two modes
  and
and  along the taper and is given by
  .
.
The second characteristic length is the local taper length  , which can be approximated as
  , where
  denotes the local cladding radius and Ω(z) the local taper angle [9]. When the condition zt
≫ zb
is satisfied at every position z along the taper – implying negligible intermodal coupling – the taper can be considered adiabatic for the fundamental mode. Consequently, designing an adiabatic taper profile requires calculating the propagation constants of the relevant modes throughout the taper as functions of
denotes the local cladding radius and Ω(z) the local taper angle [9]. When the condition zt
≫ zb
is satisfied at every position z along the taper – implying negligible intermodal coupling – the taper can be considered adiabatic for the fundamental mode. Consequently, designing an adiabatic taper profile requires calculating the propagation constants of the relevant modes throughout the taper as functions of  , implying a precise knowledge of the refractive index profile.
In this study, we consider conventional step-index optical fibers consisting of a Ge:SiO2-doped core with refractive index ncore, surrounded by a pure SiO2 cladding with refractive index nclad. Current theoretical models for the calculation of the propagation constants in such fibers rely on the following assumptions: (1) the ratio between the cladding and core diameters remains constant throughout the taper; (2) the refractive indices of both the core and the cladding are uniform along the taper; (3) the core effectively vanishes at a critical diameter, beyond which light guidance transitions from the core-cladding interface to the cladding–external medium interface. In general, for step-index telecommunication fibers, the critical cladding diameter is typically calculated to be around 40 μm [9]. Typically, to design optimized tapers, three steps should be considered: the decrease of the diameter should be firstly sharp until reaching the critical diameter, then much smoother when passing this diameter to limit the coupling with higher order modes, then sharp again. This highlights the importance to determine also the position and the value of this diameter.
In this article, for the first time to our knowledge, we report on measurements of the tapered section of a silica microfiber performed using Line-field Confocal Optical Coherence Tomography (LC-OCT), aiming to assess the validity of the existing models.
Observing the evolution of both the core and cladding over distances of a few centimeters with high resolution and sensitivity requires sophisticated techniques tailored to semi-transparent media. Compared with nano- and microtomography methods, which offer higher sensitivity [10], LC-OCT provides significantly faster acquisition times (on the order of tens of minutes to scan a  2 cm-long taper). Moreover, LC-OCT enables microscale characterization of macroscopic objects, whereas the above-mentioned methods are typically limited to lengths of only a few millimeters. Quantitative phase microscopy can also be used to obtain phase maps of the taper; however, unlike the approach presented here, the resulting images are not directly amenable to physical interpretation [11]. Altogether, these advantages make LC-OCT a complementary and powerful technique for investigating the evolution of the core and cladding in the tapered section of a microfiber, with a micrometer-scale resolution and high detection sensitivity.
This article is organized as follows:
After describing the experimental setup, we report results obtained from two different tapered sections fabricated from step-index fibers designed for telecommunications (Alcatel Clear Incolore and Corning SMF28e). Our measurements show that the assumptions commonly made for numerical modelling need to be refined for a more accurate description of the evolution of propagation modes in the tapered section.
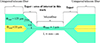 |
Fig. 1 Schematic diagram of a microfiber and its two tapers linking the uniform part to the untapered fiber. Φclad and Φcore denote the cladding and core diameters, respectively, as indicated here for conventional single-mode step-index fibers used in telecommunications. |
2. Experimental setup
LC-OCT is an optical imaging technique that combines confocal detection with low-coherence interferometry to provide real-time, cross-sectional images of semi-transparent samples [12]. The LC-OCT system used in this work, shown schematically in Figure 2, is routinely employed for cellular-level skin imaging [13, 14]. Micrometer-scale lateral and axial resolution is achieved using two identical high numerical aperture (0.5) immersion microscope objectives and broadband light with a central wavelength of 750 nm. Illumination is provided by a fiber-coupled supercontinuum light source, whose output is collimated and shaped into a line by a cylindrical lens before entering the interferometer via a beam splitter. The line of light is focused onto the sample in the object arm of the interferometer and onto a glass plate in the reference arm. The interference signal is detected by a line-scan camera, and a vertical cross-sectional image is reconstructed from a stack of lines acquired by the camera as the depth is scanned using a piezoelectric translation stage [12, 14]. The refractive index step Δn = ncore − nclad between the fiber core and the cladding being very small (typically a few 10−3), the resulting optical reflection to be detected is very weak (~10−5). To enhance the interferometric signal contrast and thereby improve detection sensitivity, the reflection coefficient of the interferometer reference surface was reduced to  by immersing it in water.
The microfibers are drawn using the classical pull-and-brush technique with a butane flame, producing high-optical-quality microfibers with symmetrical tapers in a very reproducible manner as was shown in previous studies [6, 7, 15]. Two silica step-index single-mode fibers designed for telecommunications are studied (Alcatel Clear Incolore and Corning SMF28e, respectively named fiber 1 and fiber 2). The initial cladding diameter of both fibers is 125 μm. The characteristics of fiber 2 are well-known. Its initial core diameter is 8.2 μm, and its step-index is Δn = 5.2 × 1−3 [11]. Although the parameters of fiber 1 (diameters and step-index) are less well characterized, they are known to be similar. In both cases, the targeted microfiber diameter is 1.71 μm. The length of the uniform part of the microfibers is 1 cm, and the length of the tapers is 1.8 cm. The microfiber and its two tapers are immersed in a tank filled with silicone oil (refractive index ≃1.45) to attenuate optical reflections at the fiber surface (see Fig. 2). Consequently, the contrast in optical reflection between the cladding surface and the core surface is reduced. A series of cross-sectional LC-OCT images of the taper is acquired at positions separated by 0.5 mm. Each cross-sectional image is generated by averaging 100 frames to reduce photon shot noise. The device is mechanically stable, ensuring that this averaging does not introduce blur that could degrade spatial resolution.
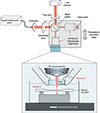 |
Fig. 2 LC-OCT setup. The tapered microfiber under study is not shown to scale and is enlarged for illustration purposes. |
3. Results and discussion
Figures 3a–3e show cross-sectional images of the tapered section of fiber 1 for different cladding diameters. The white traces indicate the cladding, and the small points at the center of the images in Figures 3a–3c indicate the core. Because the cladding and core surfaces are smooth, the optical reflection is predominantly specular. Only light reflected from surface regions that are nearly perpendicular to the illumination direction is detected. Fitting the visible cladding boundary in the image with a circle confirms its circular geometry, although only a portion of it is observed. From the initial diameter of 125 μm down to a cladding diameter of approximately 67 μm, the cladding/core interface could still be observed despite the small step index. The resolution of the LC-OCT device enabled to measure the diameter of the thinnest part, namely the microfiber (Figs. 3e and 3f), yielding a diameter value of 1.6 ± 0.1 μm. This measurement is in very good agreement with the value obtained by conventional optical microscopy using an immersion microscope objective (see Fig. 3g), giving a diameter of 1.5 ± 0.1 μm. Both measurements are also in good agreement with the targeted diameter of 1.71 μm. Performing measurements by Scanning Electron Microscopy (SEM) provides much higher resolution but is far more complex to implement than this optical method. Moreover, in our previous works, we have performed SEM measurements that have shown that our drawing machine yields very good results in terms of diameter accuracy and homogeneity [7, 15].
In Figure 4a, we report the evolution of the cladding and core diameters along the taper. As the diameters decrease, the reflectivities also decrease due to the progressive diffusion of the Ge:SiO2 core during the tapering process, leading to a reduction of the step index value. In particular, the smallest core diameter that could be measured is 1.85 μm for a cladding diameter of 67 μm. Below this value, the detection limit of LC-OCT is reached [12], corresponding to a minimum reflectivity  , which is obtained for a refractive-index step of
  .
.
In Figure 4b, we plot the ratio of the core to cladding diameters,  . This ratio is not constant, varying from 0.064 to 0.05 over the first 4.5 mm in the taper. It then decreases abruptly to 0.027 for the last point that could be measured.
Our hypothesis is that there are two distinct effects occurring during the tapering process: the geometrical reduction of the initial core size and the expansion of the region of higher refractive index, due to the diffusion of Ge into the cladding in the vicinity of the initial core. We still name this region “core”. These two combined effects could explain the behavior observed in Figure 4b, that can be separated into three parts:
-
At the beginning, until z = 2.5 mm, the increase in core size due to diffusion is negligible compared to the reduction in core size from the fiber stretching, giving an almost constant ratio
 .
. -
After z = 2.5 mm, there is a more pronounced increase in the ratio R until z = 3.5 mm because of a more important diffusion reducing the core diameter decrease speed.
Then after z = 3.5 mm, R decreases sharply because of both the reduction of the geometrical size of the core and the fact that the index difference  is flattened due to diffusion and becomes lower than the detection limit.
The same measurements were performed with a taper drawn from fiber 2. The results are shown in Figure 5.
Even for large cladding diameters, the core was more difficult to observe than for fiber 1, which we attribute to a smaller initial step index. The step index for the untapered fiber 2 being known ( ), we deduce that the step index of untapered fiber 1 should be higher. Determining its exact value would require a calibration of the LC-OCT system, which we were not able to do for practical reasons. As for fiber 1, the vanishing of the core corresponds to the limit of detection of the LC-OCT device. We conclude that the range of variation of the step index we were able to measure for fiber 2 extends from
  to
to  . In Figure 5a, the core vanishes for a cladding diameter of 91 μm, and the smallest core diameter that could be measured is 2.7 μm. The smallest cladding diameter measured is 1.8 μm, in good agreement with the targeted diameter of 1.71 μm. In Figure 5b, we report the ratio of the core and cladding diameters. As for fiber 1, this ratio decreases, from 0.072 to 0.023. The decrease appears more monotonic than for fiber 1, with a two step behavior without any increase of the ratio R, suggesting that the diffusion of Ge does not counter balance the effect of the geometrical reduction of the core size. Further investigations based on measurement of the chemical composition of the taper (synchrotron or X-rays for instance) would be necessary to confirm this assumption. Moreover, fewer data points were acquired, which prevents a definitive comparison. Similar measurements were performed on 3 identical microfibers drawn from fiber 1 and 2 from fiber 2, showing the same results.
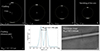 |
Fig. 3 From (a) to (e). Cross-sectional images of the tapered section of fiber 1 for 5 different cladding diameters (125, 97, 80, 67 and 1.6 μm). The yellow dotted lines represent a fit of the external boundary of the fiber with a circle. (f) Measurement of the thinnest part diameter obtained by LC-OCT. (g) Optical microscopy image of the thinnest part of the fiber. |
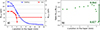 |
Fig. 4 (a) Evolution of the cladding (blue triangles) and core diameters (red dots) versus the z position in the taper drawn from fiber 1. Error bars on Φcore are ±0.1 μm (smaller than the size of the cladding marks). (b) Evolution of the ratio of the core and cladding diameter R = Φcore/Φclad versus the z position in the taper in the area where the core diameter is measurable. Error bars are smaller than the size of the marks (±0.1%). |
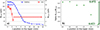 |
Fig. 5 (a) Evolution of the cladding (blue triangles) and core diameters (red dots) versus the z position in the taper drawn from fiber 2. Error bars on Φcore are ±0.5 μm (smaller than the size of the cladding marks). (b) Evolution of the ratio of the core and cladding diameter Φcore/Φclad versus the z position in the taper in the area where the core diameter is measurable. Error bars are smaller than the size of the marks (±0.1%). |
4. Conclusion and perspectives
To our knowledge, we report for the first time measurements of the evolution of the cladding and core diameters along the tapered section of a microfiber fabricated using the classical pull-and-brush technique, obtained by LC-OCT. This imaging technique is particularly attractive, as it does not require complex preparation of the samples and enables fast high-sensitivity measurements with micrometer-scale resolution of semi-transparent objects such as silica tapers.
The results show that, contrary to assumptions commonly used in numerical models, the ratio of the core to cladding diameters is not constant along the taper. We attribute this behavior to both the fiber origin and the fabrication process. Moreover, the step-index is found to decrease, at least down to a value of ~10−4, corresponding to the detection limit of LC-OCT. At last, for both fibers, we measured that the critical diameter is not obtained for a diameter of 40 μm as currently used but depends on the single mode fiber: for fiber 1, this diameter is 67 μm whereas for fiber 2, it is 91 μm. These results can be used to optimize the shape of the tapers and to calculate more precisely the effective index of the propagation mode in the taper.
Future work will focus on collecting additional data to obtain reliable statistics and on investigating other types of optical fibers (e.g., polarization-maintaining fiber, visible single-mode fibers, fibers with other silica dopings, …). These results will enable the refinement of numerical models of mode propagation in tapers, particularly for the design and optimization of adiabatic taper profiles.
Funding
The work was supported by internal fundings.
Conflicts of interest
The authors declare that there are no conflicts of interest related to this article.
Data availability statement
This article has no associated data generated.
Author contribution statement
A. Dubois and S. Lebrun collected and processed the data and wrote the article. A. Baudry and S. Lebrun fabricated the nanofibers. A. Dubois, A. Baudry and S. Lebrun discussed the results and reviewed the article.
References
- Tong LM et al., Subwavelength-diameter silica wires for low-loss optical wave guiding, Nature 426, 816–819 (2003) https://doi.org/10.1038/nature02193. [NASA ADS] [CrossRef] [Google Scholar]
- Berroir J et al., Ultralow-power single-pass all-optical photon router, Optica 12 (8), 1250–51 (2025). https://doi.org/10.1364/OPTICA.569736. [Google Scholar]
- Horikawa S et al., Low-loss telecom-band nanofiber cavity for interfacing Yb atomic qubits, Opt. Lett. 50 (17), 5294–5298 (2025) https://doi.org/10.1364/OL.570362. [Google Scholar]
- Zhang L, et al., Micro-/nanofiber optics: merging photonics and material science on nanoscale for advanced sensing technology, iScience 23(1), 100810 (2020). https://doi.org/10.1016/j.isci.2019.100810. [Google Scholar]
- Birks TA, et al., Supercontinuum generation in tapered fibers, Opt. Lett. 25(19), 1415–1417 (2000). https://doi.org/10.1364/ol.25.001415. PMID: 18066233. [Google Scholar]
- Delaye P, et al., Continuous-wave generation of photon pairs in silica nanofibers using single-longitudinal and multilongitudinal-mode pumps, Phys. Rev. A 104, 063715 (2021). https://doi.org/10.1103/PhysRevA.104.063715. [Google Scholar]
- Bouhadida M et al., Highly efficient and reproducible evanescent Raman converters based on a silica nanofiber immersed in a liquid, Appl. Phys. B 125, 228 (2019). https://doi.org/10.1007/s00340-019-7340-7. [NASA ADS] [CrossRef] [Google Scholar]
- Fanjoux G et al., Demonstration of the evanescent Kerr effect in optical nano fibers, Opt. Express 27, 29460–29470 (2019). https://doi.org/10.1364/OE.27.029460. [Google Scholar]
- Love JD et al., IEE Proc. Pt. J. Optoelect. 138 (5), 343–354 (1991). https://doi.org/10.1049/ip-j.1991.0061. [Google Scholar]
- Crocco MC et al., Multiscale X-ray computed tomography of standard optical fibers, Tomogr. Mater. Struct. 9, 100078 (2025) https://doi.org/10.1016/j.tmater.2025.100078. [Google Scholar]
- Belanger E et al., Comparative study of quantitative phase imaging techniques for refractometry of optical waveguides, Opt. Express 26 (13), 17498 (2018) https://doi.org/10.1364/OE.26.017498. [Google Scholar]
- Dubois A et al., Line-field confocal time-domain optical coherence tomography with dynamic focusing, Opt. Express 26, 33534–33542 (2018). https://doi.org/10.1364/OE.26.033534. [Google Scholar]
- Dubois A et al., Line-field confocal optical coherence tomography for highresolution noninvasive imaging of skin tumors, J. Biomed. Opt. 23, 106007 (2018). https://doi.org/10.1117/1.JBO.23.10.106007. [Google Scholar]
- Latriglia F et al., Line-field confocal optical coherence tomography (LC-OCT) for skin imaging in dermatology, Life 13, 2268 (2023). https://doi.org/10.3390/life13122268. [Google Scholar]
- Shan Let al., Stimulated Raman scattering in the evanescent field of liquid immersed tapered nanofibers, Appl. Phys. Lett. 102 (20), 201110 (2013). https://doi.org/10.1063/1.4807170. [CrossRef] [Google Scholar]
All Figures
|
Fig. 1 Schematic diagram of a microfiber and its two tapers linking the uniform part to the untapered fiber. Φclad and Φcore denote the cladding and core diameters, respectively, as indicated here for conventional single-mode step-index fibers used in telecommunications. |
| In the text | |
|
Fig. 2 LC-OCT setup. The tapered microfiber under study is not shown to scale and is enlarged for illustration purposes. |
| In the text | |
|
Fig. 3 From (a) to (e). Cross-sectional images of the tapered section of fiber 1 for 5 different cladding diameters (125, 97, 80, 67 and 1.6 μm). The yellow dotted lines represent a fit of the external boundary of the fiber with a circle. (f) Measurement of the thinnest part diameter obtained by LC-OCT. (g) Optical microscopy image of the thinnest part of the fiber. |
| In the text | |
|
Fig. 4 (a) Evolution of the cladding (blue triangles) and core diameters (red dots) versus the z position in the taper drawn from fiber 1. Error bars on Φcore are ±0.1 μm (smaller than the size of the cladding marks). (b) Evolution of the ratio of the core and cladding diameter R = Φcore/Φclad versus the z position in the taper in the area where the core diameter is measurable. Error bars are smaller than the size of the marks (±0.1%). |
| In the text | |
|
Fig. 5 (a) Evolution of the cladding (blue triangles) and core diameters (red dots) versus the z position in the taper drawn from fiber 2. Error bars on Φcore are ±0.5 μm (smaller than the size of the cladding marks). (b) Evolution of the ratio of the core and cladding diameter Φcore/Φclad versus the z position in the taper in the area where the core diameter is measurable. Error bars are smaller than the size of the marks (±0.1%). |
| In the text | |
Current usage metrics show cumulative count of Article Views (full-text article views including HTML views, PDF and ePub downloads, according to the available data) and Abstracts Views on Vision4Press platform.
Data correspond to usage on the plateform after 2015. The current usage metrics is available 48-96 hours after online publication and is updated daily on week days.
Initial download of the metrics may take a while.