Fig. 2
Download original image
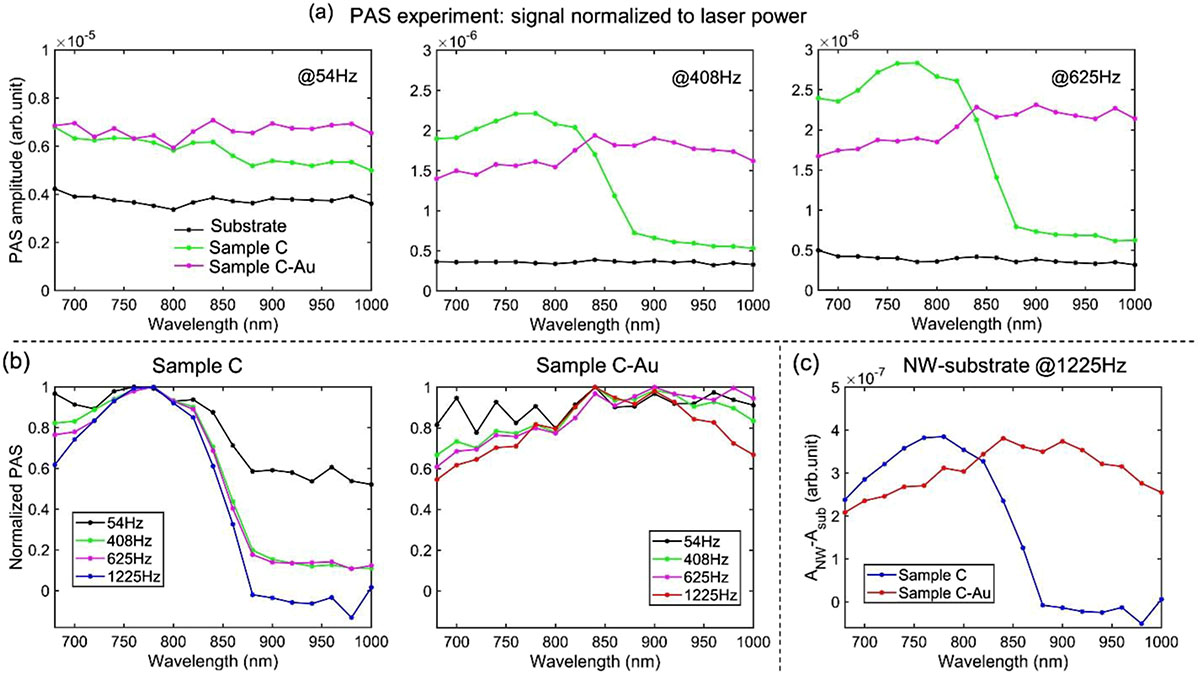
(a) PAS signal amplitude of samples C, C-Au and the substrate (without Au), excited at normal incidence and modulated with 54Hz, 408 Hz and 625 Hz chopper frequency; the excitation is at normal incidence with linear polarization. All the signals are normalized to the incident laser power at the corresponding wavelength. (b) Normalized PAS signal for both nanostructured samples is obtained by subtracting the substrate signal from the NW signal, and normalizing each spectra to its maximum. The resonant modes appear at higher frequencies, and their bandwidth shrinks. (c) PAS difference between the NWs and the substrate for Sample C and Sample C-Au agree with the NW modes predicted by simulations.
Current usage metrics show cumulative count of Article Views (full-text article views including HTML views, PDF and ePub downloads, according to the available data) and Abstracts Views on Vision4Press platform.
Data correspond to usage on the plateform after 2015. The current usage metrics is available 48-96 hours after online publication and is updated daily on week days.
Initial download of the metrics may take a while.