Fig. 1
Download original image
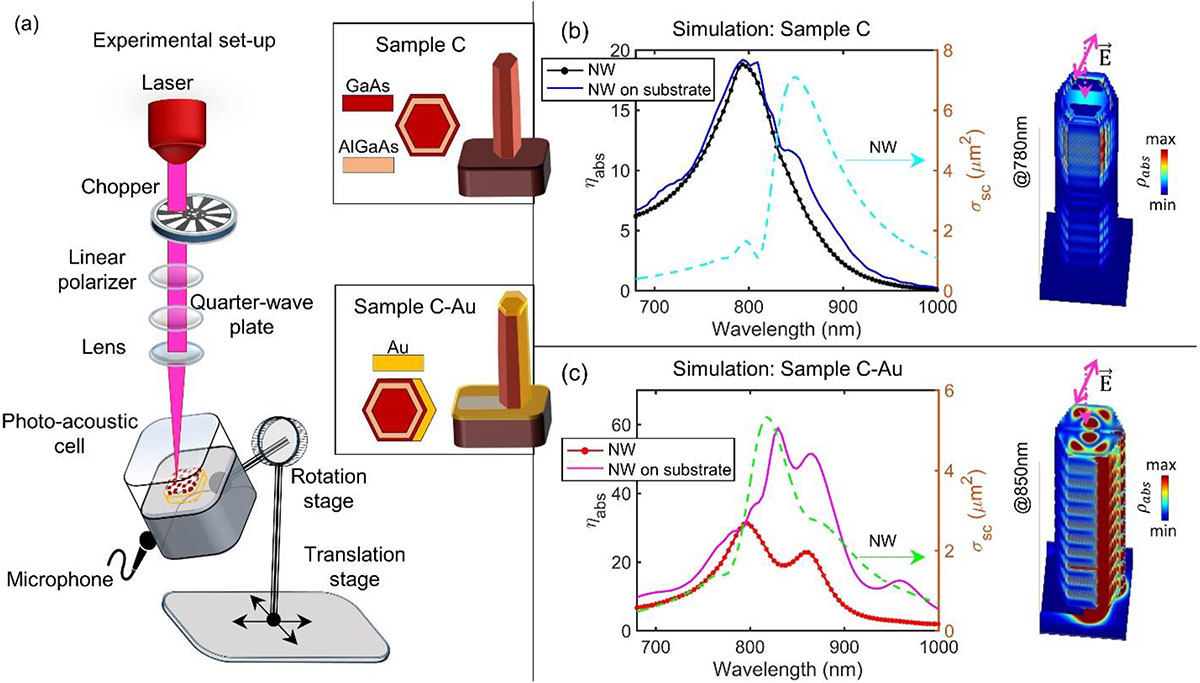
(a) Photo-acoustic spectroscopy, allows for tunable polarization, power, modulation frequency, incidence angle; inset: schematic of the two samples. Both have diameter of 165 nm and height of 4.6 μm; Sample C-Au has two out of six sidewalls covered by 20 nm Au. (b) Simulation of a single NW of Sample C, in the air and standing on the Si substrate, and the 3D distribution of the absorption density at the resonance of 780 nm. The Si substrate widens the leaky waveguide mode resonance. (c) Simulation of a single NW covered by Au, and the 3D distribution of the absorption density at 850 nm. Here, the substrate strongly influences absorption as its parts contain absorbing material.
Current usage metrics show cumulative count of Article Views (full-text article views including HTML views, PDF and ePub downloads, according to the available data) and Abstracts Views on Vision4Press platform.
Data correspond to usage on the plateform after 2015. The current usage metrics is available 48-96 hours after online publication and is updated daily on week days.
Initial download of the metrics may take a while.