Fig. 6
Download original image
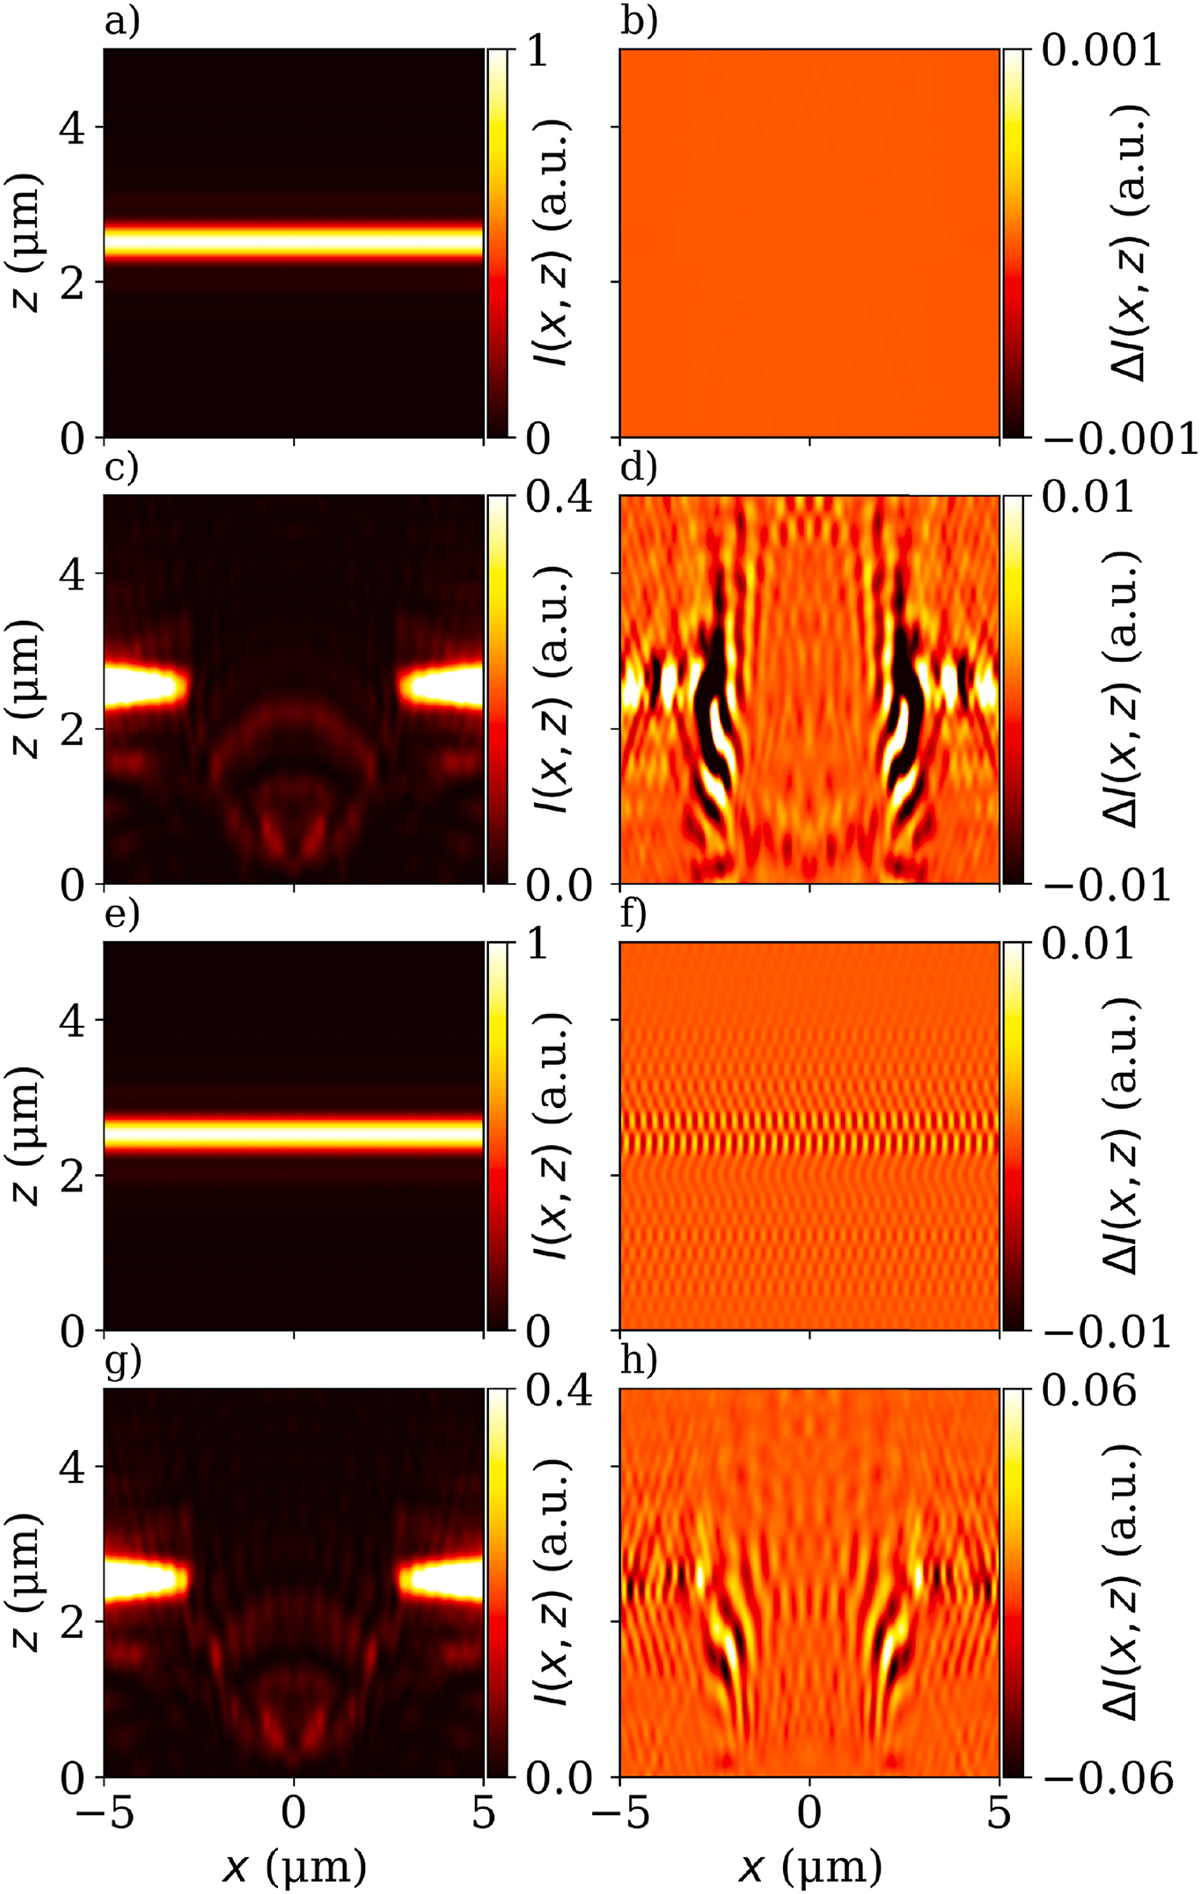
Intensity distributions for simulated confocal study cases. The first column shows the I(x, z) for the sinusoidal grating for Λ1 = 260 nm (a, c) and Λ2 = 300 nm (e, g). The second column depicts ΔI(x, z), respectively. In c), d) and g), h) the results with microcylinder-assistance are shown. (The intensity distributions for Iinv(x, z) are not plotted).
Current usage metrics show cumulative count of Article Views (full-text article views including HTML views, PDF and ePub downloads, according to the available data) and Abstracts Views on Vision4Press platform.
Data correspond to usage on the plateform after 2015. The current usage metrics is available 48-96 hours after online publication and is updated daily on week days.
Initial download of the metrics may take a while.