Fig. 3
Download original image
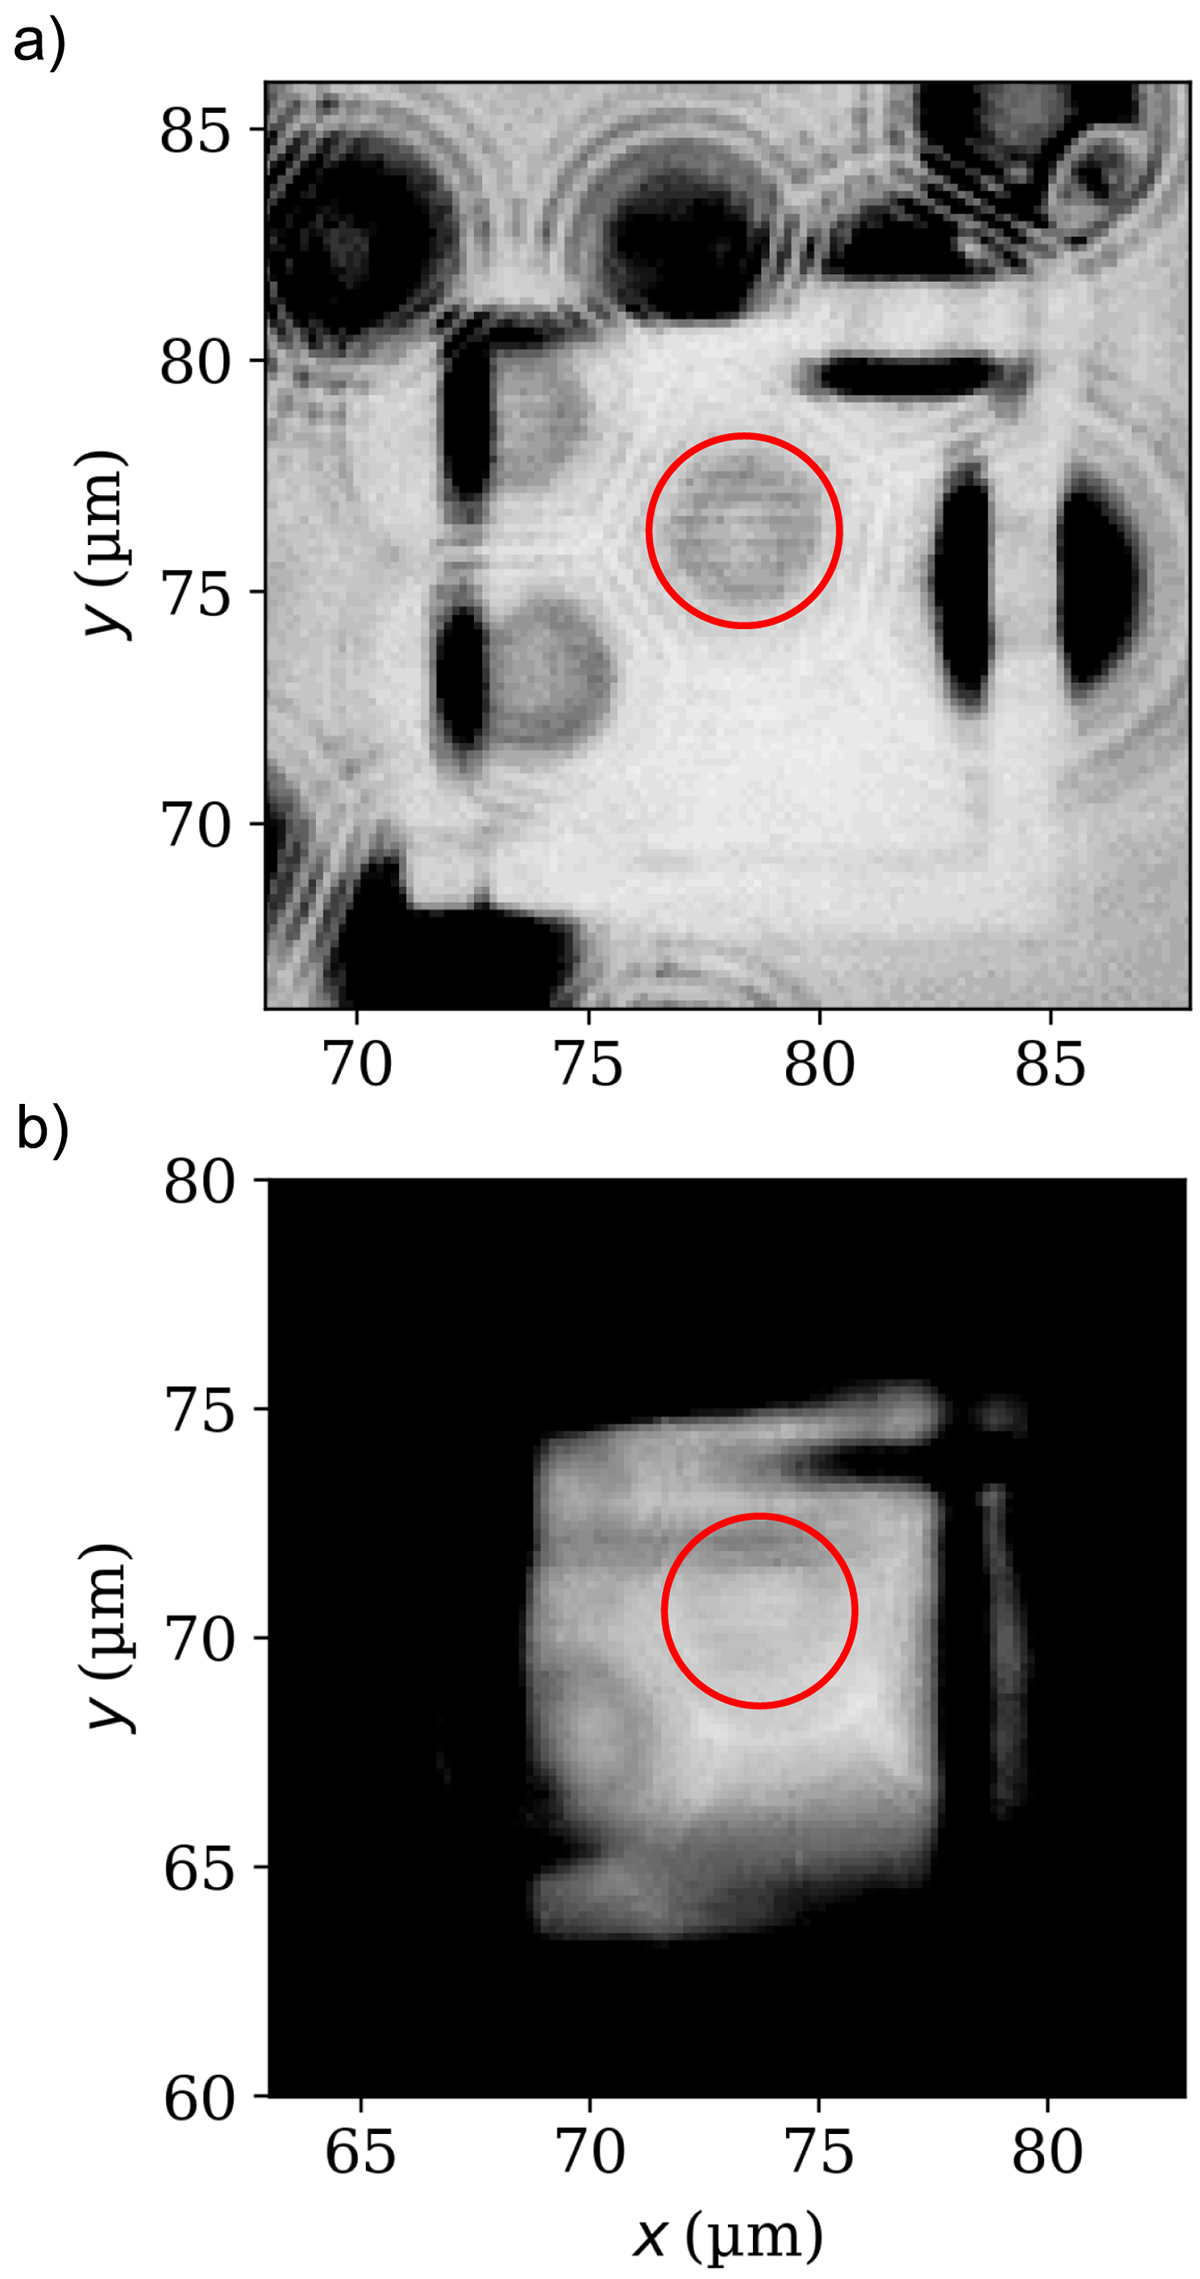
Slice of an image stack acquired with confocal microscopy (a) compared to a conventional microscopic image (b) of the same field of view. The area used for the surface reconstruction shown in Figure 4 is marked in red. The complete image section shows one of the squarely arranged structures on the measurement object (supracon linewidth/pitch standard, Λ2 = 300 nm) with the microspheres placed on it. The focal plane is selected so that the focus is visible through the microspheres. (Note that in (b) the colorbar of the image is heavily adapted to make the red-marked area sufficiently visible).
Current usage metrics show cumulative count of Article Views (full-text article views including HTML views, PDF and ePub downloads, according to the available data) and Abstracts Views on Vision4Press platform.
Data correspond to usage on the plateform after 2015. The current usage metrics is available 48-96 hours after online publication and is updated daily on week days.
Initial download of the metrics may take a while.