


Figure 7
Download original image
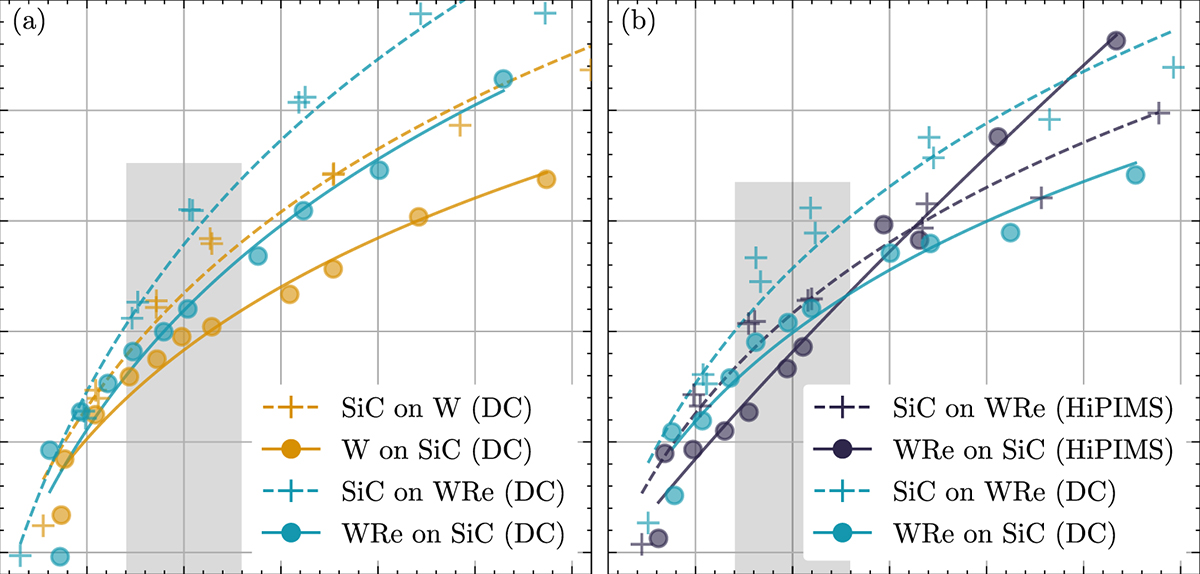
Two-by-two comparison of the MET sample groups: (a) W/SiC (dcMS) vs. WRe/SiC (dcMS) and (b) WRe/SiC (dcMS) vs. WRe/SiC (HiPIMS). The fitted interface widths  from TEM analysis are plotted as a function of the local period di for each interface. Tendency lines are added to guide the eye. Interest d-spacing zones are displayed in gray.
Current usage metrics show cumulative count of Article Views (full-text article views including HTML views, PDF and ePub downloads, according to the available data) and Abstracts Views on Vision4Press platform.
Data correspond to usage on the plateform after 2015. The current usage metrics is available 48-96 hours after online publication and is updated daily on week days.
Initial download of the metrics may take a while.