


Figure 6
Download original image
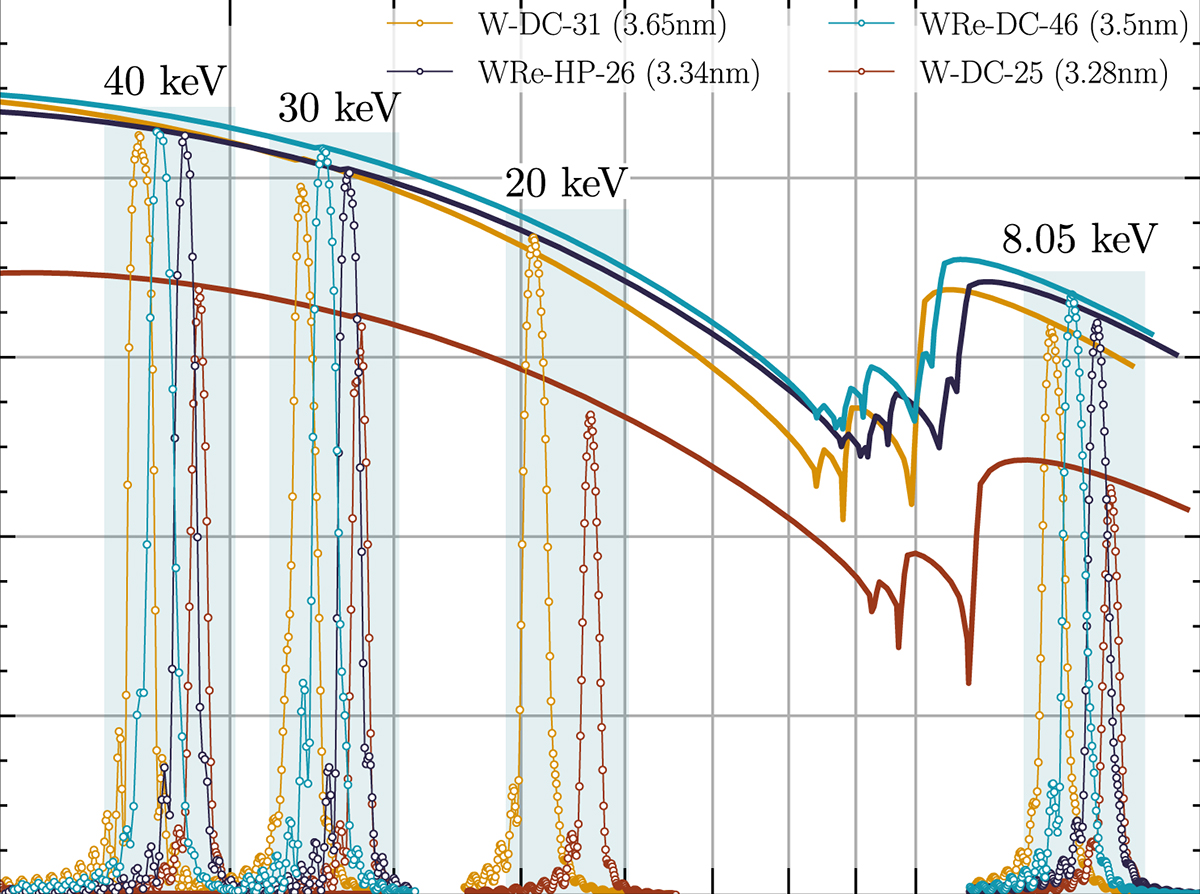
X-ray reflectivity curves measured (symbols), along with best-fit simulations (thin solid lines). The fitted structural parameters extracted from simultaneous fitting of multi-energy data are listed in Table 1. Bragg peaks and Kiessig fringes are clearly visible, indicating high structural quality. Thick solid lines are described in Section 4.1.
Current usage metrics show cumulative count of Article Views (full-text article views including HTML views, PDF and ePub downloads, according to the available data) and Abstracts Views on Vision4Press platform.
Data correspond to usage on the plateform after 2015. The current usage metrics is available 48-96 hours after online publication and is updated daily on week days.
Initial download of the metrics may take a while.