


Figure 5
Download original image
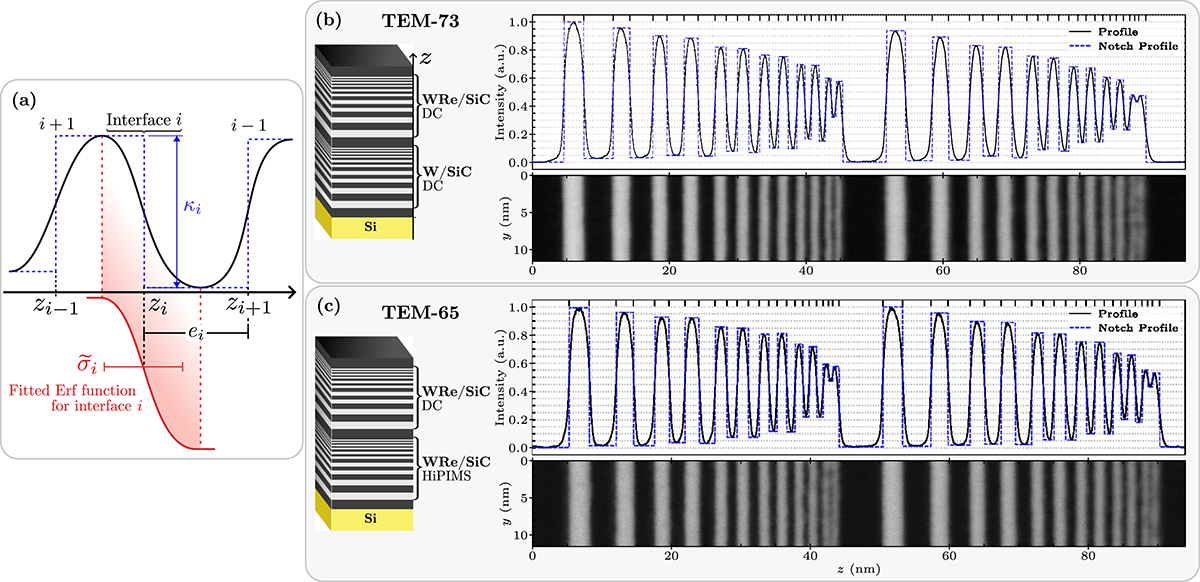
(a) Schematic illustration of the quantitative analysis procedure for HAADF-STEM images. Interface positions are determined by fitting the profile with the error function at each interface. (b) HAADF-STEM image and intensity profile for sample TEM-73, comparing WRe/SiC (top stack) and W/SiC (bottom stack), both deposited by dcMS. (c) HAADF-STEM image and intensity profile for sample TEM-65, comparing WRe/SiC deposited by dcMS (top) and HiPIMS (bottom). Brighter layers correspond to absorbers (W or WRe), darker layers to SiC spacers.
Current usage metrics show cumulative count of Article Views (full-text article views including HTML views, PDF and ePub downloads, according to the available data) and Abstracts Views on Vision4Press platform.
Data correspond to usage on the plateform after 2015. The current usage metrics is available 48-96 hours after online publication and is updated daily on week days.
Initial download of the metrics may take a while.