


Fig. 5
Download original image
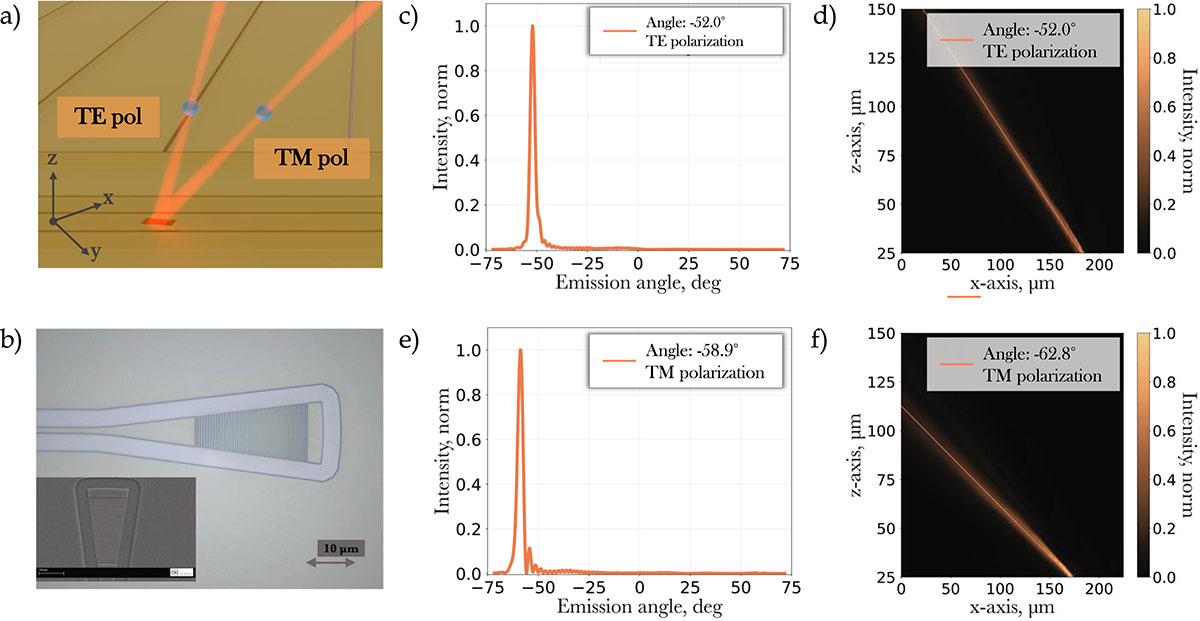
a) Schematic illustration of the two beams emitted from the GC, corresponding to orthogonal TE and TM polarizations. b) Top-view optical microscope image of the fabricated Si3N4/SiO2 GC. (c, e) Simulated far-field intensity distributions as a function of emission angle, evaluated in a plane 100 μm above the chip surface, for TE and TM polarizations, respectively. (d, f) Experimental intensity maps acquired from 25 μm to 150 μm above the chip surface were fitted to reconstruct the emission profiles of the GC for TE and TM polarizations, respectively.
Current usage metrics show cumulative count of Article Views (full-text article views including HTML views, PDF and ePub downloads, according to the available data) and Abstracts Views on Vision4Press platform.
Data correspond to usage on the plateform after 2015. The current usage metrics is available 48-96 hours after online publication and is updated daily on week days.
Initial download of the metrics may take a while.