


Fig. 3
Download original image
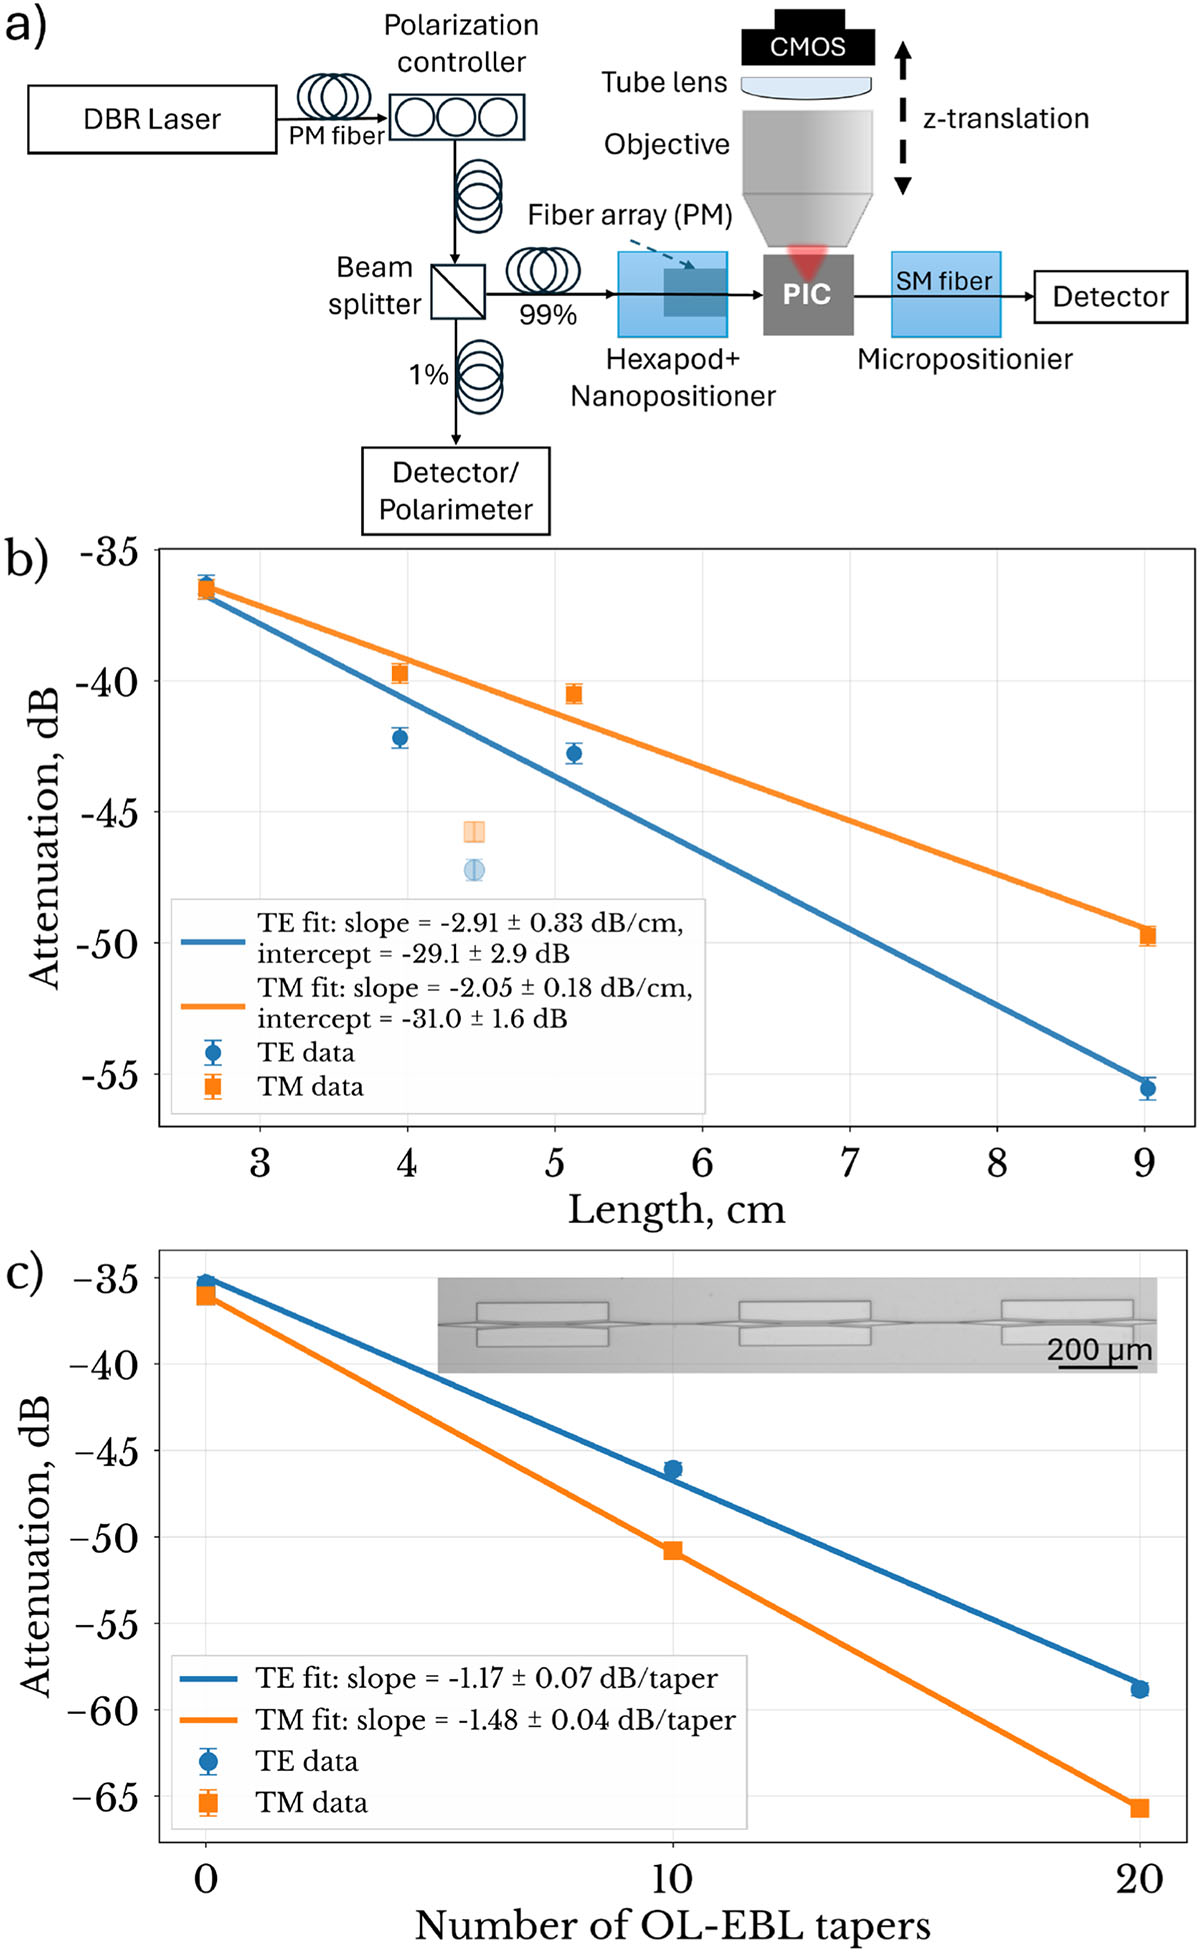
a) Schematic illustration of the optical characterization setup. The red cone illustrates the beam emitted from the PIC. b) Cutback measurement to deduce the coupling and propagation losses for the TE and TM modes at a wavelength of 760 nm. Data points shown with reduced opacity were excluded from the fit. c) Characterization of the EBL–OL transition taper, showing the extracted taper loss. The inset displays the cascaded taper section.
Current usage metrics show cumulative count of Article Views (full-text article views including HTML views, PDF and ePub downloads, according to the available data) and Abstracts Views on Vision4Press platform.
Data correspond to usage on the plateform after 2015. The current usage metrics is available 48-96 hours after online publication and is updated daily on week days.
Initial download of the metrics may take a while.