Figure 3
Download original image
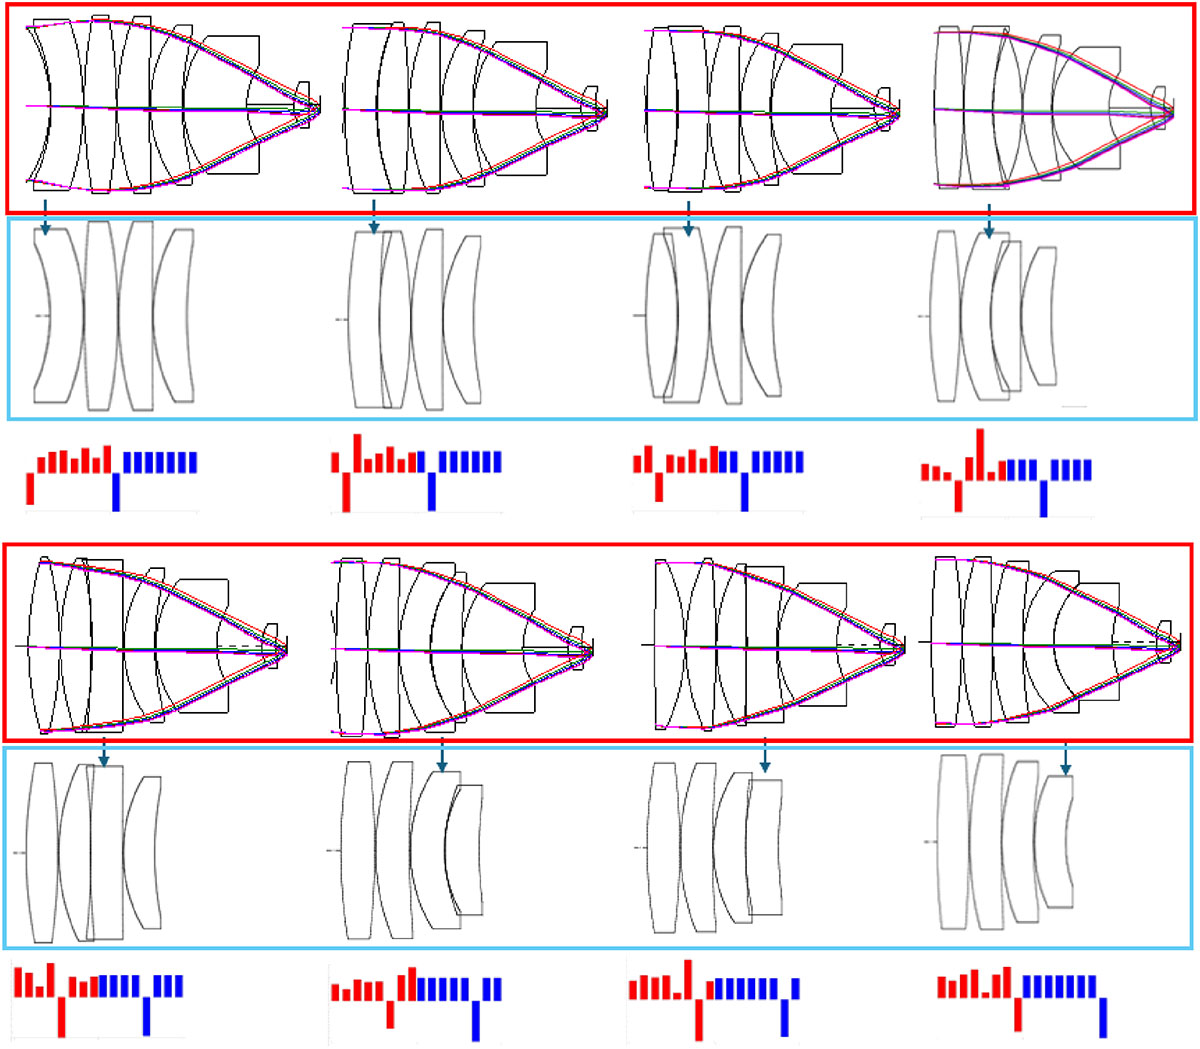
Eight local minima in the vicinity of the system in Figure 2 are shown in the red boxes. Only the last six lenses are shown, which include the four lenses of interest. The lenses with the most significant change compared to Figure 2 are marked with an arrow. For the four lenses of interest the blue bar charts show the z-values that result from theory, one negative z-value and seven equal positive z-values. When these z-values are translated into surface curvatures, the lenses in the blue boxes are obtained. For comparison, the red bar charts show the z-values obtained from data extracted from the optimized systems.
Current usage metrics show cumulative count of Article Views (full-text article views including HTML views, PDF and ePub downloads, according to the available data) and Abstracts Views on Vision4Press platform.
Data correspond to usage on the plateform after 2015. The current usage metrics is available 48-96 hours after online publication and is updated daily on week days.
Initial download of the metrics may take a while.