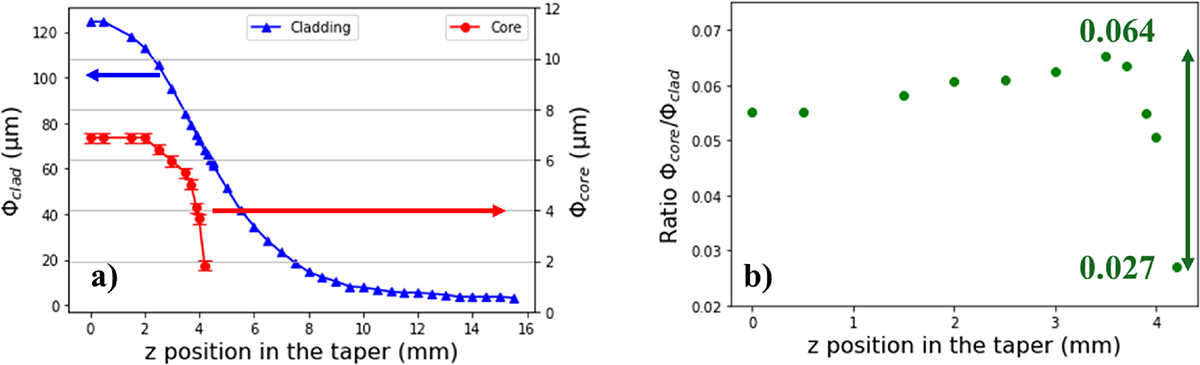
Fig. 4
Download original image
(a) Evolution of the cladding (blue triangles) and core diameters (red dots) versus the z position in the taper drawn from fiber 1. Error bars on Φcore are ±0.1 μm (smaller than the size of the cladding marks). (b) Evolution of the ratio of the core and cladding diameter R = Φcore/Φclad versus the z position in the taper in the area where the core diameter is measurable. Error bars are smaller than the size of the marks (±0.1%).
Current usage metrics show cumulative count of Article Views (full-text article views including HTML views, PDF and ePub downloads, according to the available data) and Abstracts Views on Vision4Press platform.
Data correspond to usage on the plateform after 2015. The current usage metrics is available 48-96 hours after online publication and is updated daily on week days.
Initial download of the metrics may take a while.