Figure 7
Download original image
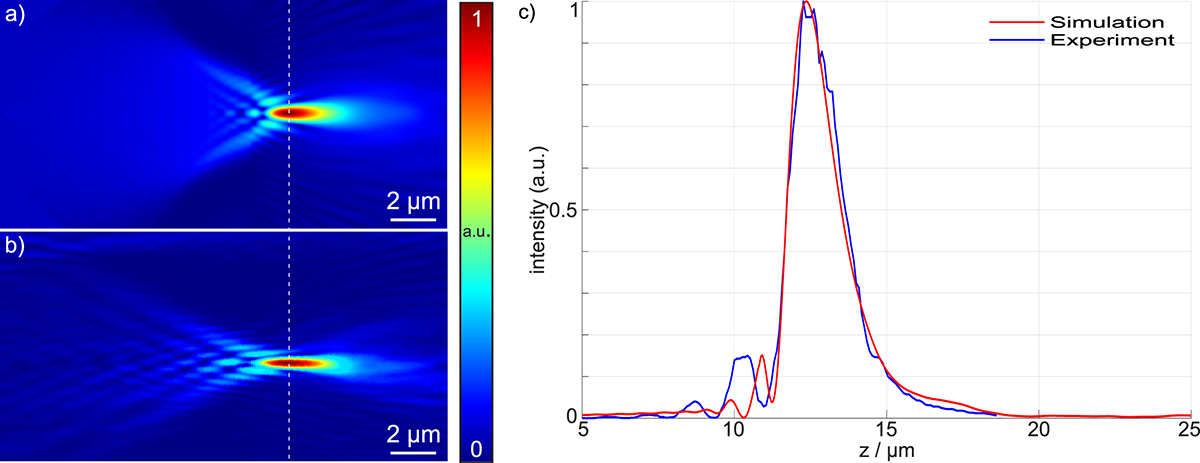
Experimental validation of the FRISP method with a SiO2 micro sphere with a diameter of 11 μm. The normalized intensity distribution of a Photonic nanojet generated by a SiO2 micro sphere along the propagation axis a) simulated and b) measured by an optical microscope. c) Comparison of the intensities along the centerline of the simulation a) (red) and the experiment b) (blue).
Current usage metrics show cumulative count of Article Views (full-text article views including HTML views, PDF and ePub downloads, according to the available data) and Abstracts Views on Vision4Press platform.
Data correspond to usage on the plateform after 2015. The current usage metrics is available 48-96 hours after online publication and is updated daily on week days.
Initial download of the metrics may take a while.