Figure 5
Download original image
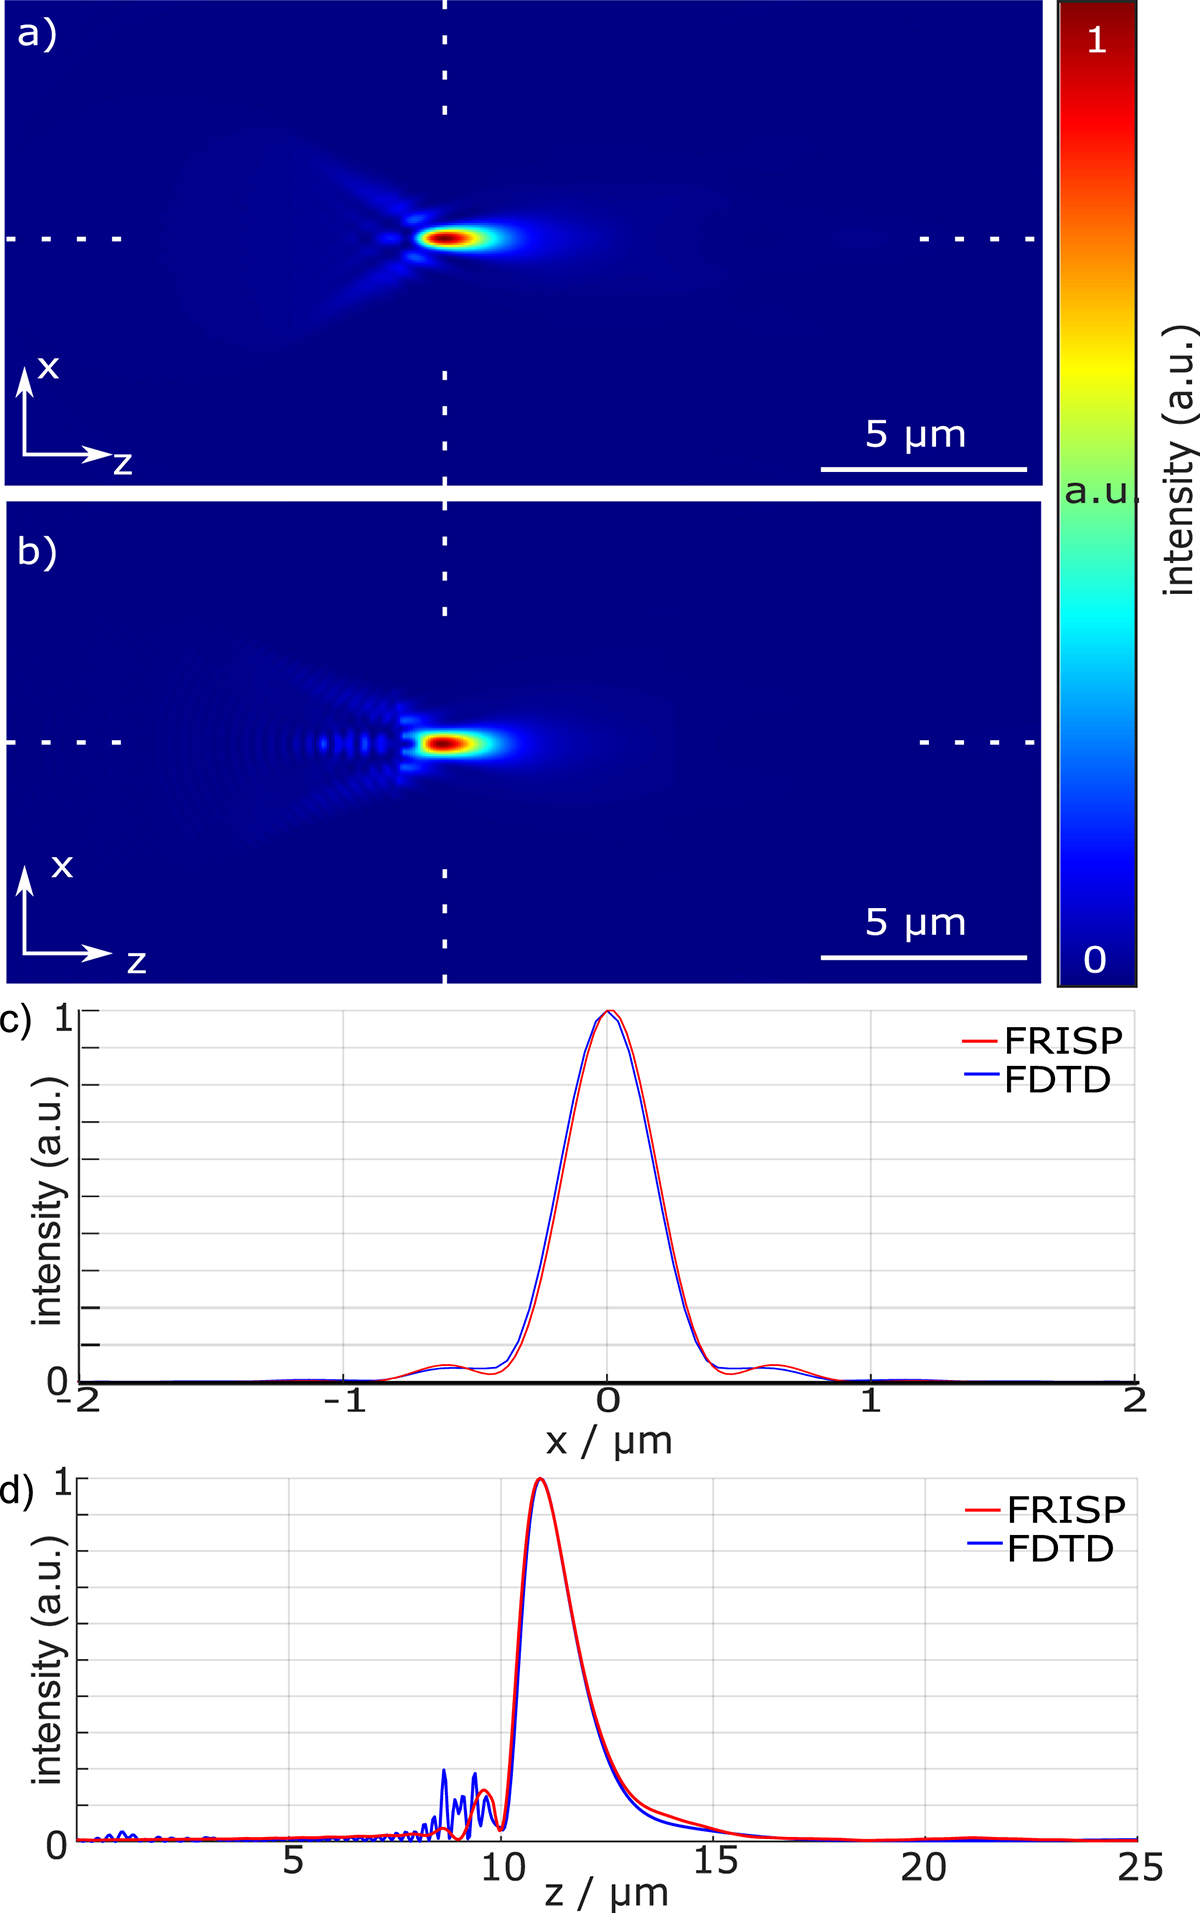
Comparison of the FRISP method with a FDTD simulation of a microsphere with a diameter of 10 μm, a refractive index of n = 1.5 and a wavelength of 634 nm. The normalized intensity distribution of a simulated photonic nanojets generated by the microsphere along the propagation axis a) for the FRISP method and b) for a FDTD simulation with Ansys. c) Comparison of the intensity profiles at the focal spot position along the vertical dashed lines to determine the FWHM. d) Intensity profiles along the horizontal dashed lines through the center of the micro sphere.
Current usage metrics show cumulative count of Article Views (full-text article views including HTML views, PDF and ePub downloads, according to the available data) and Abstracts Views on Vision4Press platform.
Data correspond to usage on the plateform after 2015. The current usage metrics is available 48-96 hours after online publication and is updated daily on week days.
Initial download of the metrics may take a while.