Figure 2
Download original image
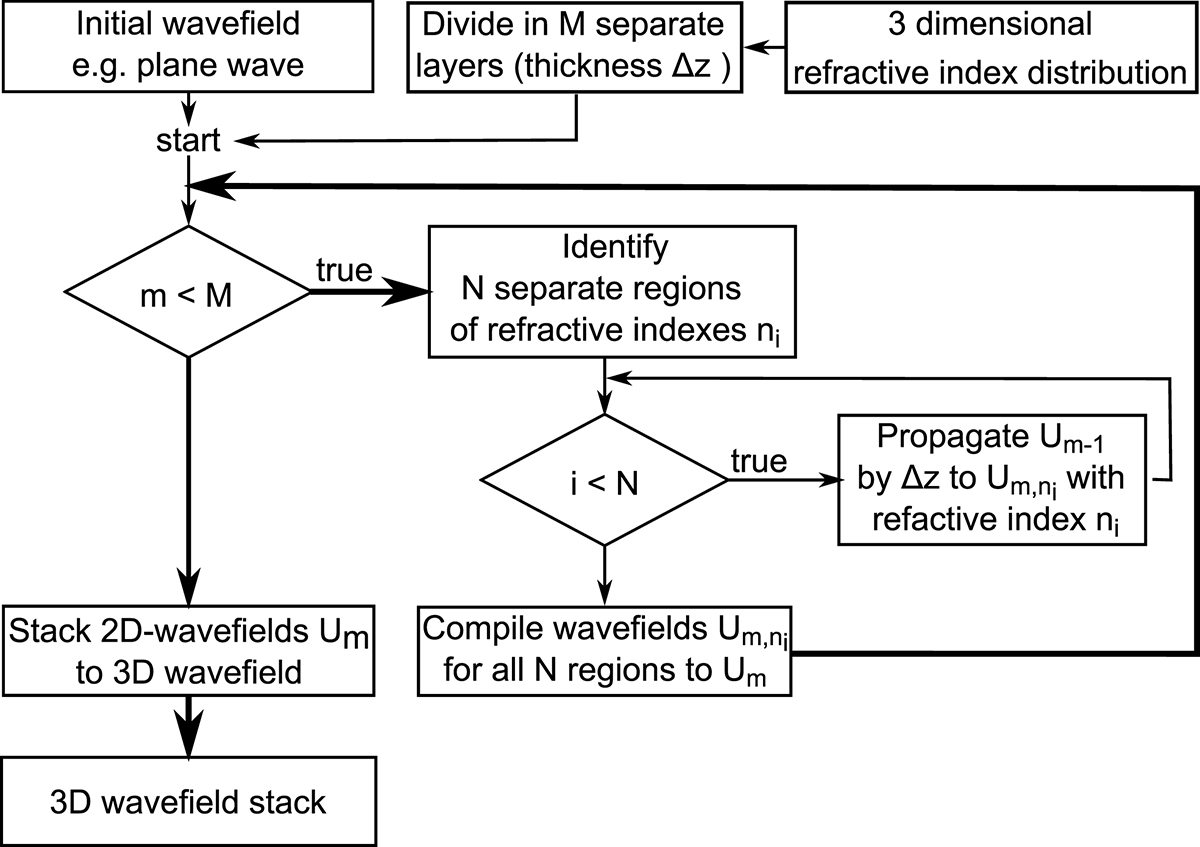
Flowchart of the simulation of a 3D microstructure with N different refractive indices ni and M layers with a layer thickness Δz. During the calculation of the 3D wave front stack, there are 2 loops. The outer loop (bold lines) represents the propagation of the M layers (see Fig. 1a)). The inner loop is used to calculate the wavefront Um with several refractive indices ni (see Fig. 1b)).
Current usage metrics show cumulative count of Article Views (full-text article views including HTML views, PDF and ePub downloads, according to the available data) and Abstracts Views on Vision4Press platform.
Data correspond to usage on the plateform after 2015. The current usage metrics is available 48-96 hours after online publication and is updated daily on week days.
Initial download of the metrics may take a while.