Figure 6
Download original image
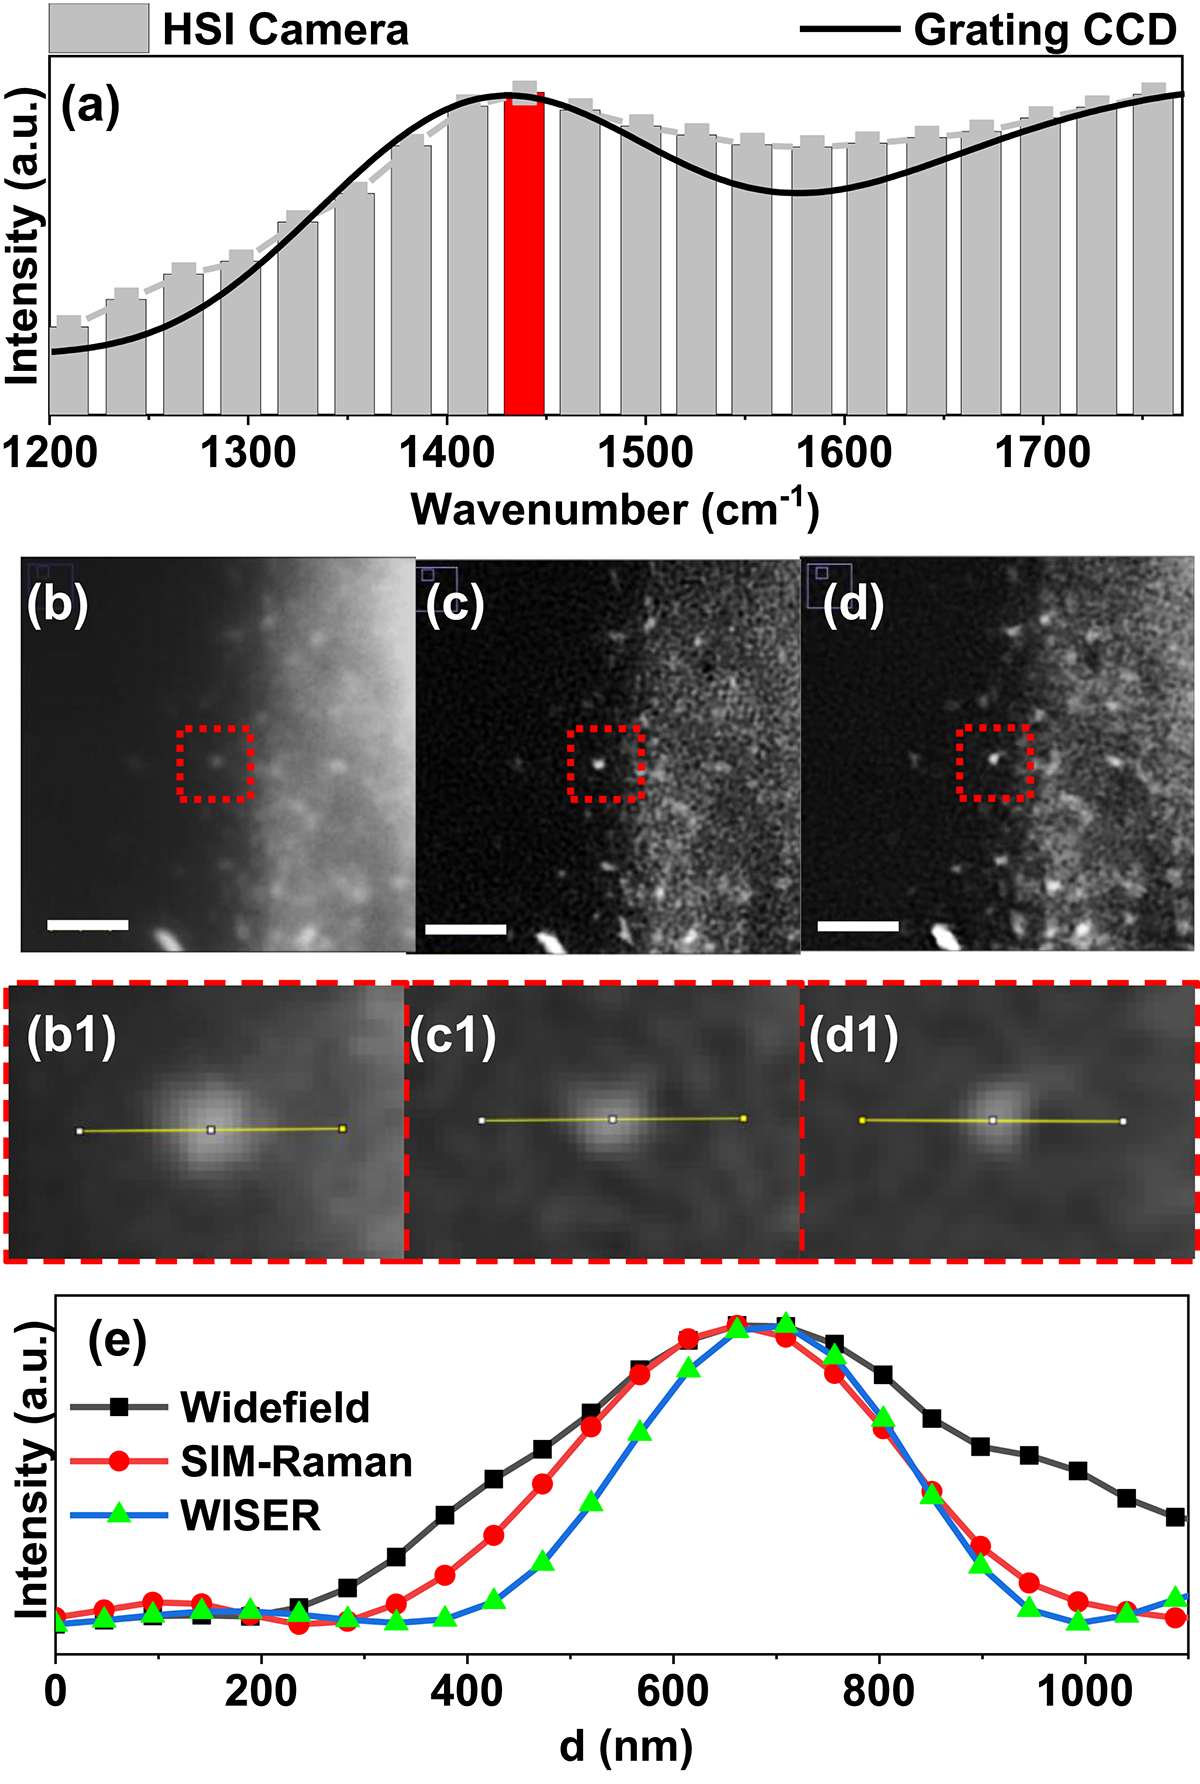
(a) Representative spectra from the hyperspectral image and a monochromator. (b) Wide-field image acquired using a narrow band filter by wide-field illumination without structured light. (c) Structured illumination image acquired using a narrow band filter with illumination using structured light. (d) Structured illumination image using hyperspectral imaging. (b1–d1) show the corresponding zoomed-in image of the marked areas in (b–d). (e) The intensity profile along the line shown in image b1–d1.
Current usage metrics show cumulative count of Article Views (full-text article views including HTML views, PDF and ePub downloads, according to the available data) and Abstracts Views on Vision4Press platform.
Data correspond to usage on the plateform after 2015. The current usage metrics is available 48-96 hours after online publication and is updated daily on week days.
Initial download of the metrics may take a while.