Open Access
Figure 14
Download original image
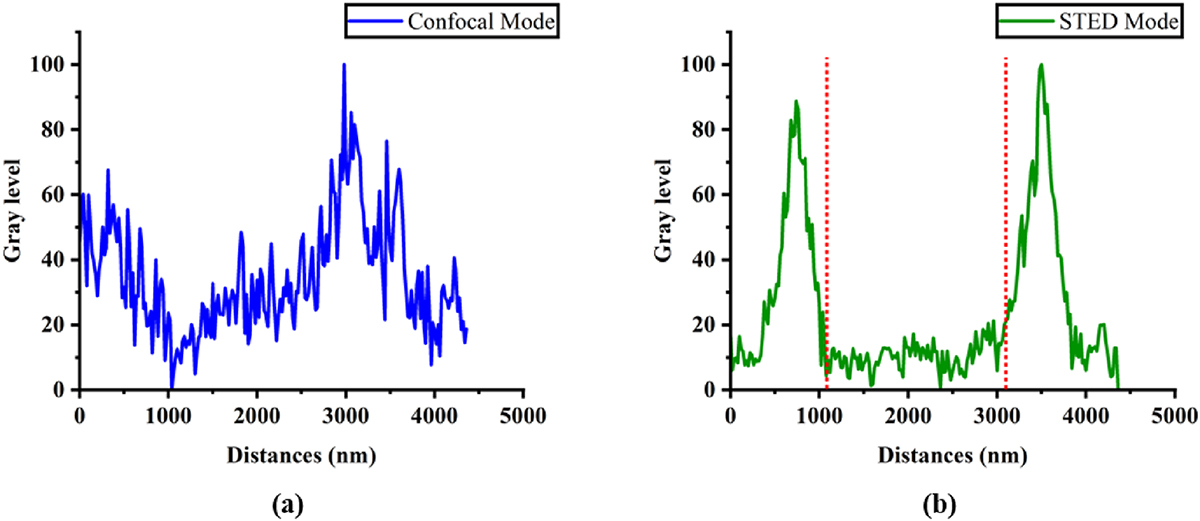
Intensity profile of the yellow arrow in image of the cross -shaped pattern for confocal mode (a) and STED mode (b). The dotted lines in diagram (b) show the border of the pattern based on the drop of intensity in STED mode.
Current usage metrics show cumulative count of Article Views (full-text article views including HTML views, PDF and ePub downloads, according to the available data) and Abstracts Views on Vision4Press platform.
Data correspond to usage on the plateform after 2015. The current usage metrics is available 48-96 hours after online publication and is updated daily on week days.
Initial download of the metrics may take a while.