Figure 3
Download original image
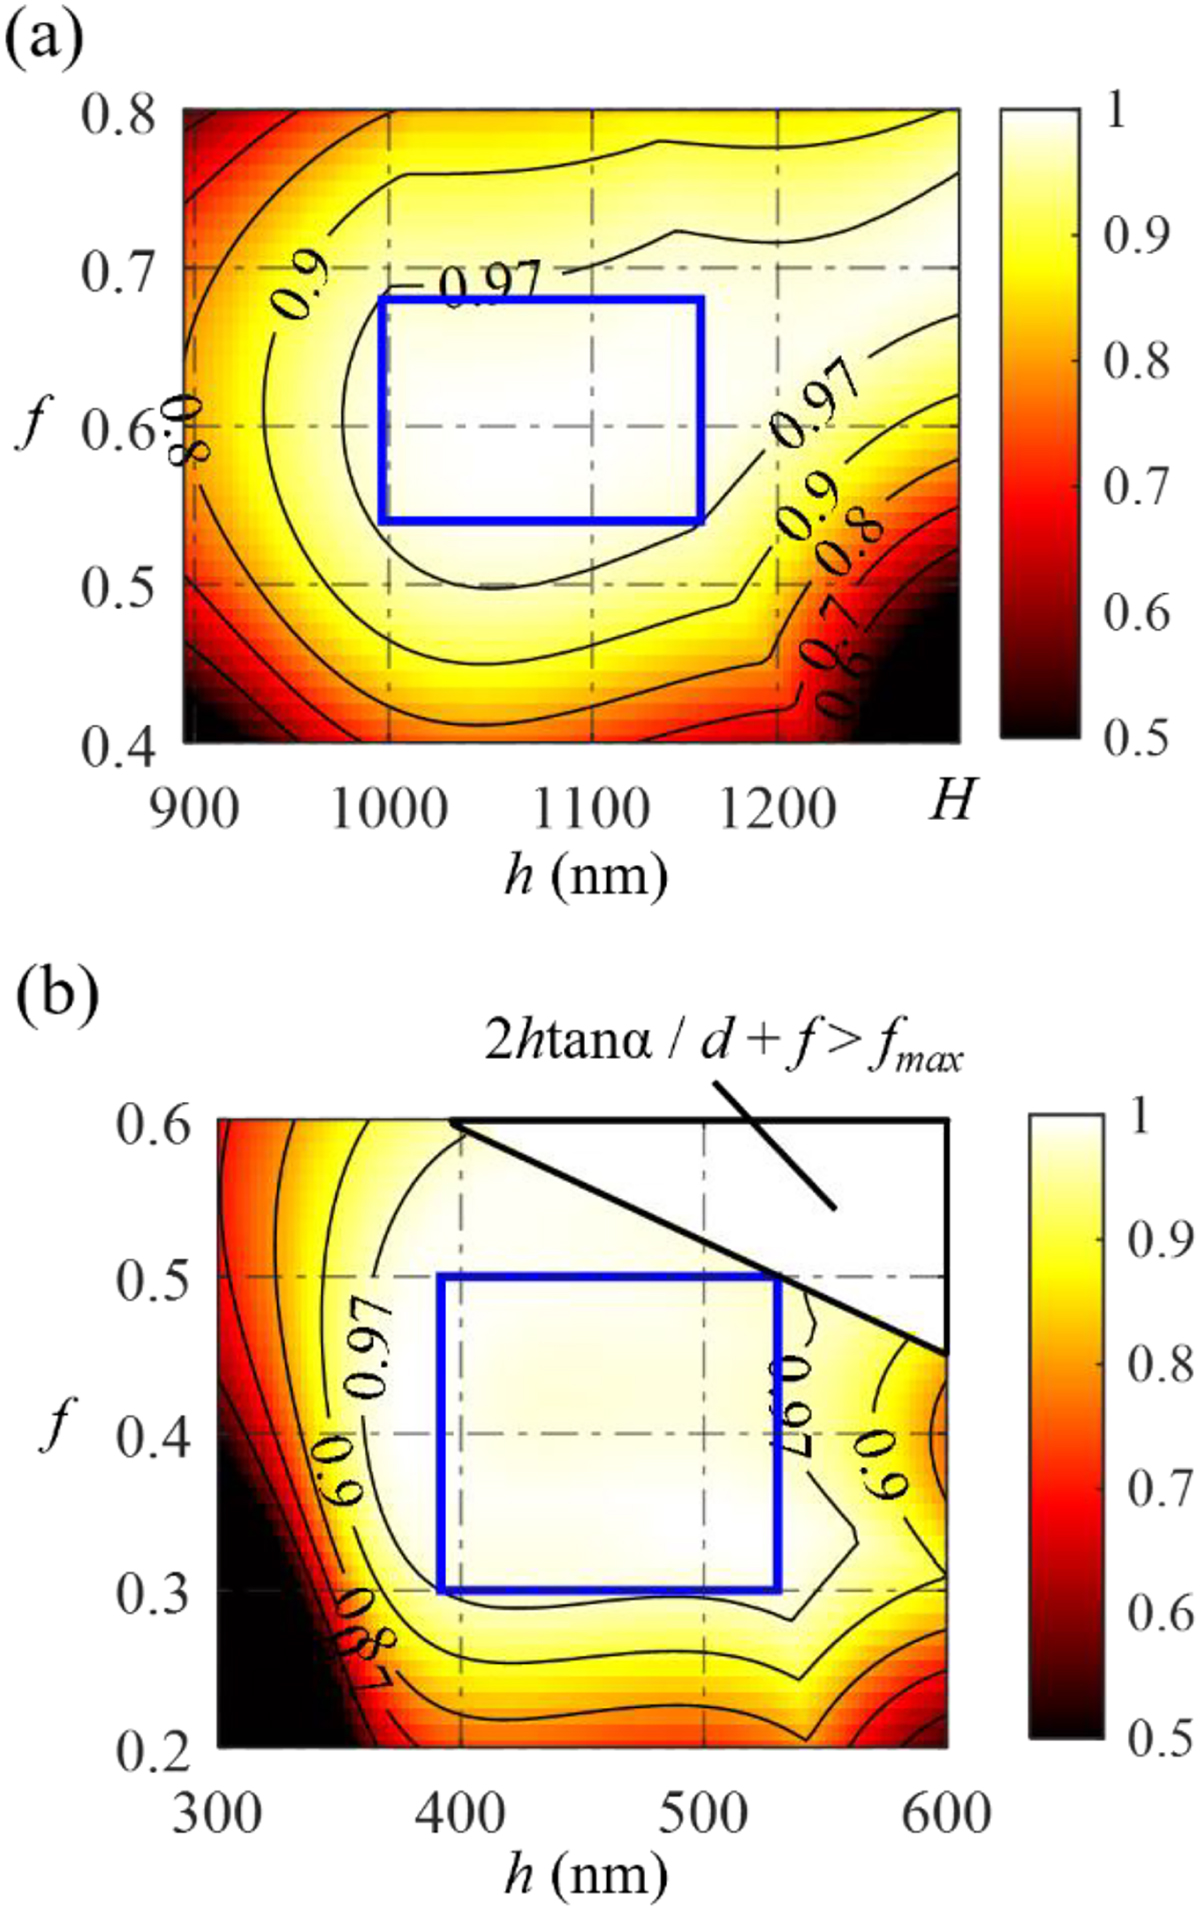
Design results: (a) for Grating 1 and (b) for Grating 2. The color map and contour lines depict η calculated by using the formulas in Section 3.1. The blue rectangular boxes delineate the boundaries of Ω(ϕ*), inscribed within the contour lines of η = 97% (η*). The upper-right white triangular area in (b) belongs to the domain where the lower base width of the trapezoid is greater than fmaxd = 0.9d.
Current usage metrics show cumulative count of Article Views (full-text article views including HTML views, PDF and ePub downloads, according to the available data) and Abstracts Views on Vision4Press platform.
Data correspond to usage on the plateform after 2015. The current usage metrics is available 48-96 hours after online publication and is updated daily on week days.
Initial download of the metrics may take a while.