Fig. A1
Download original image
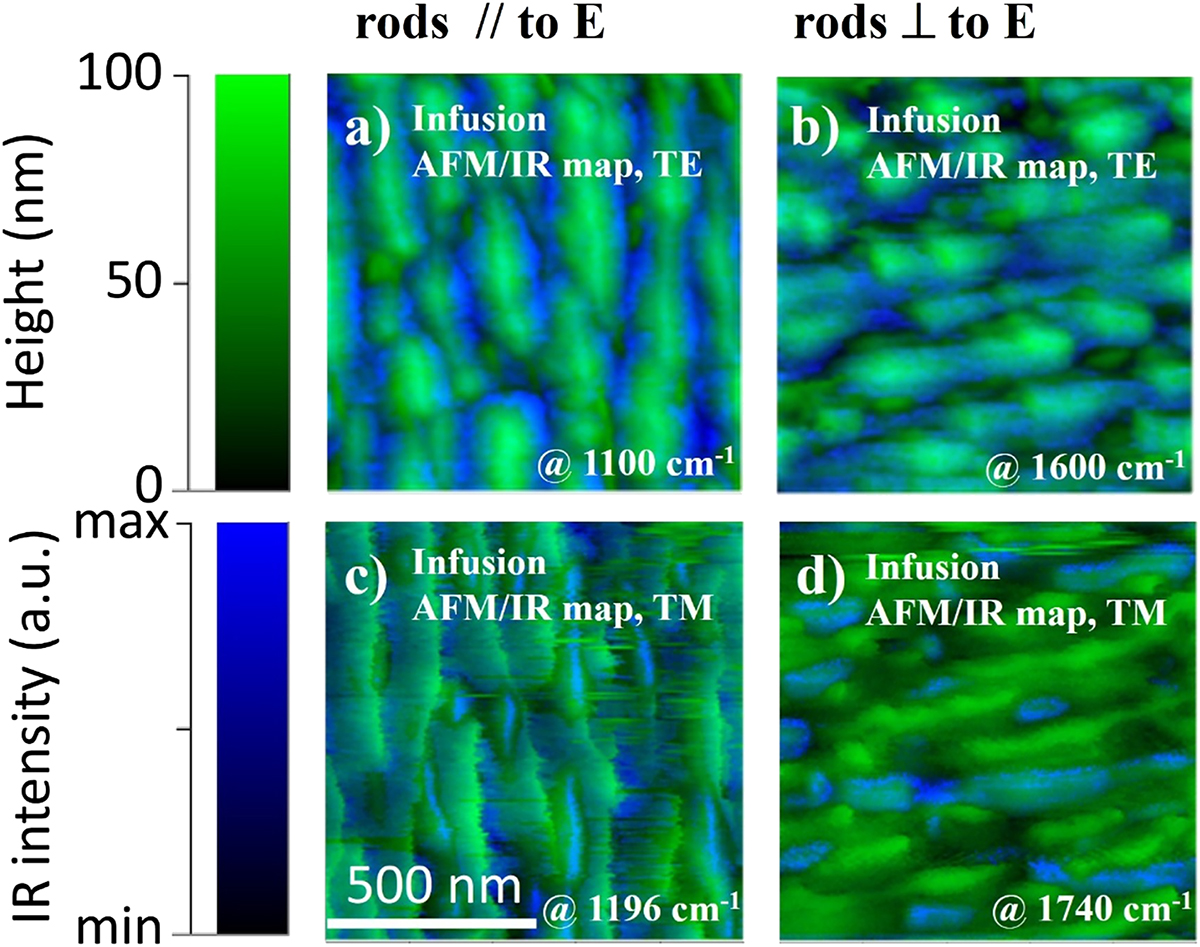
(a, b) Infusion maps of AFM height maps (green scale bar) and IR maps (blue scale bar) for TE polarization with E parallel (a) and perpendicular (b) to the main axis of the nanorods. IR maps are acquired at 1100 cm−1 and 1600 cm−1 for (a) and (b), respectively. (c, d) Infusion maps of AFM height maps and IR maps for TM polarization with E parallel (c) and perpendicular (d) to the main axis of the nanorods. IR maps are acquired at 1196 cm−1 and 1740 cm−1 for (a) and (b), respectively. In all infusion maps, regardless of light polarization and relative orientations between E and the main axis of the nanorods, it is possible to identify an overall distribution of blue regions with higher IR intensity.
Current usage metrics show cumulative count of Article Views (full-text article views including HTML views, PDF and ePub downloads, according to the available data) and Abstracts Views on Vision4Press platform.
Data correspond to usage on the plateform after 2015. The current usage metrics is available 48-96 hours after online publication and is updated daily on week days.
Initial download of the metrics may take a while.