Fig. 4
Download original image
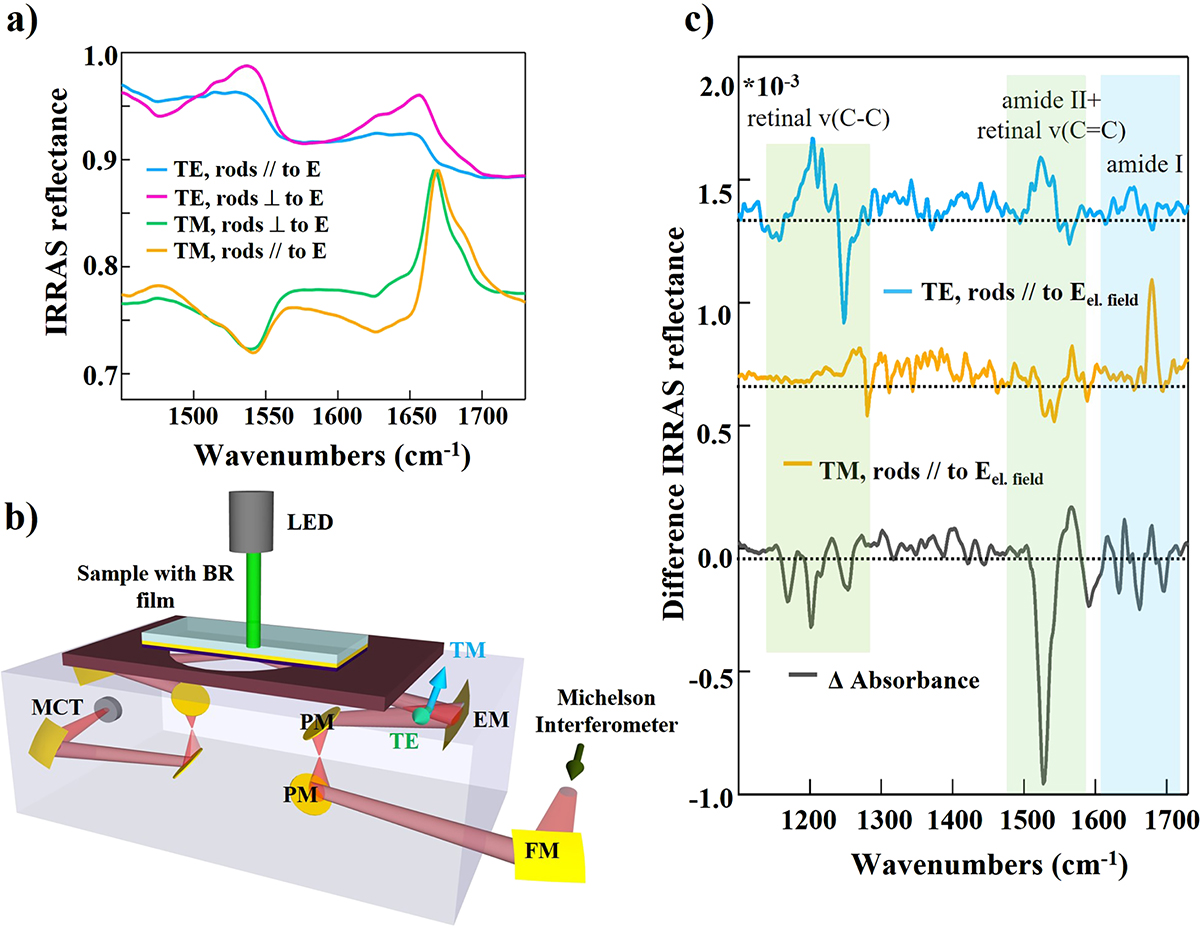
(a) IRRAS reflectance spectra in the amide bands region of the nanorod platform with BR film deposited on top for all four possible configurations of nanorod orientation and light polarization. (b) Sketch of the experimental IRRAS setup to perform difference IRRAS spectroscopy of BR proteins. The green light emitted by a LED at 565 nm is sent to the backside of the platform exploiting its semi-transparency and it is used to start the BR photocyle. (c) IRRAS difference spectra of the nanorod platform with BR film using TE- (blue curve) and TM-polarized light (orange curve). For both curves the main axis of nanorods is parallel to E. The FTIR difference spectrum acquired on a 2-μm thick film of BR proteins deposited on a CaF2 window in transmission mode is reported as grey curve.
Current usage metrics show cumulative count of Article Views (full-text article views including HTML views, PDF and ePub downloads, according to the available data) and Abstracts Views on Vision4Press platform.
Data correspond to usage on the plateform after 2015. The current usage metrics is available 48-96 hours after online publication and is updated daily on week days.
Initial download of the metrics may take a while.