Fig. 3
Download original image
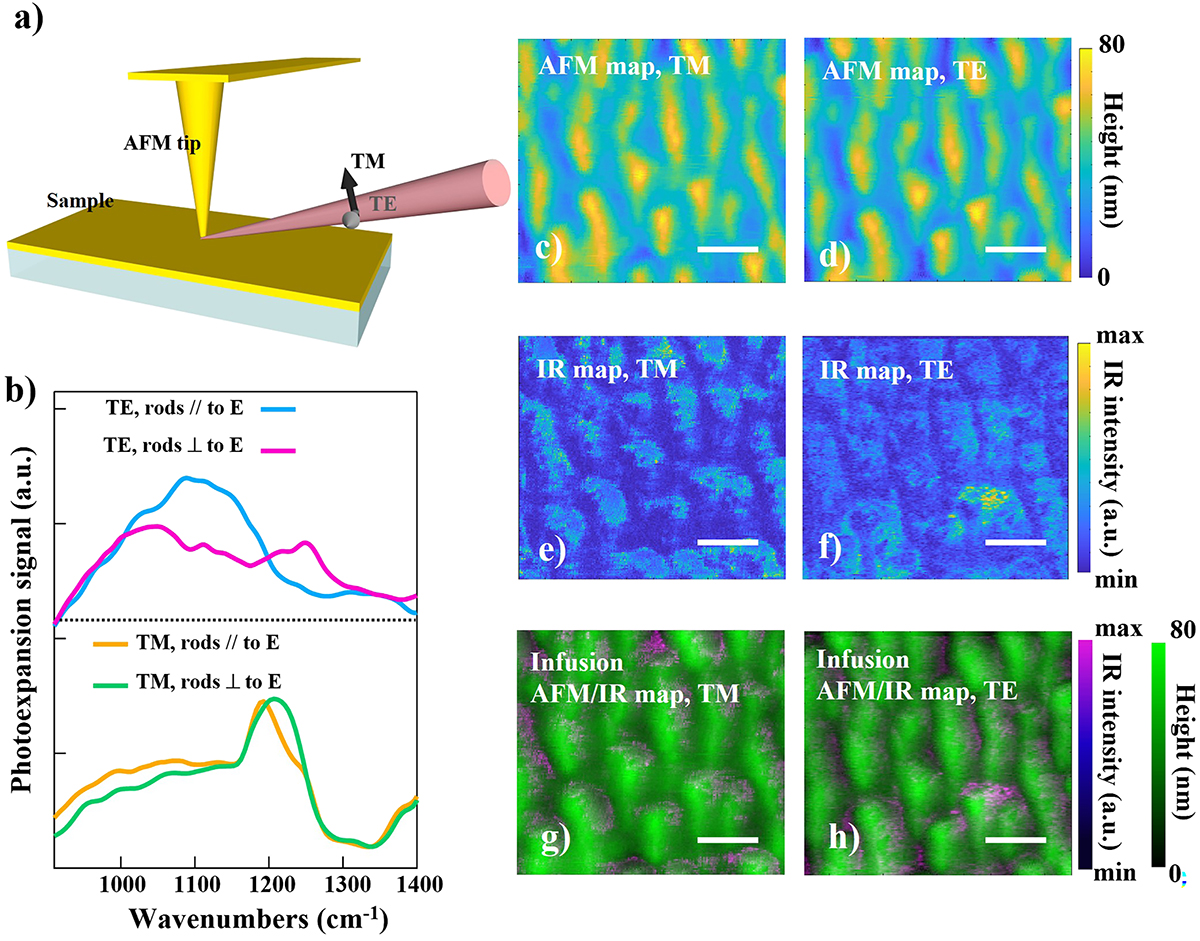
(a) Sketch of AFM-IR setup with an oblique incidence of IR radiation of 70° with respect to the sample surface normal. (b) Top, AFM-IR absorption spectra in TE polarization with E parallel (blue curve, TE-Long axis) and perpendicular (pink curve, TE-Short axis) to the main axis of the nanorods. Bottom, same of top for TM polarization: orange curve and green curve for TM-Long axis and TM-Short axis, respectively. (c, d) AFM height maps for TM (c) and TE (d) polarizations and (e, f) IR maps at 1600 cm−1 (λ = 6.2 μm) for TM (short-axis) (e) and TE (long-axis) (f) polarizations. In order to acquire these maps, we have covered the nanorods with a thin polymer layer. (g, h) Infusion maps of AFM height maps and IR maps for TM (g) and TE (h) polarizations. It is possible to identify regions with higher IR intensity for both polarizations of the impinging radiation. For all maps the scale bar is 200 nm.
Current usage metrics show cumulative count of Article Views (full-text article views including HTML views, PDF and ePub downloads, according to the available data) and Abstracts Views on Vision4Press platform.
Data correspond to usage on the plateform after 2015. The current usage metrics is available 48-96 hours after online publication and is updated daily on week days.
Initial download of the metrics may take a while.