Fig. 1
Download original image
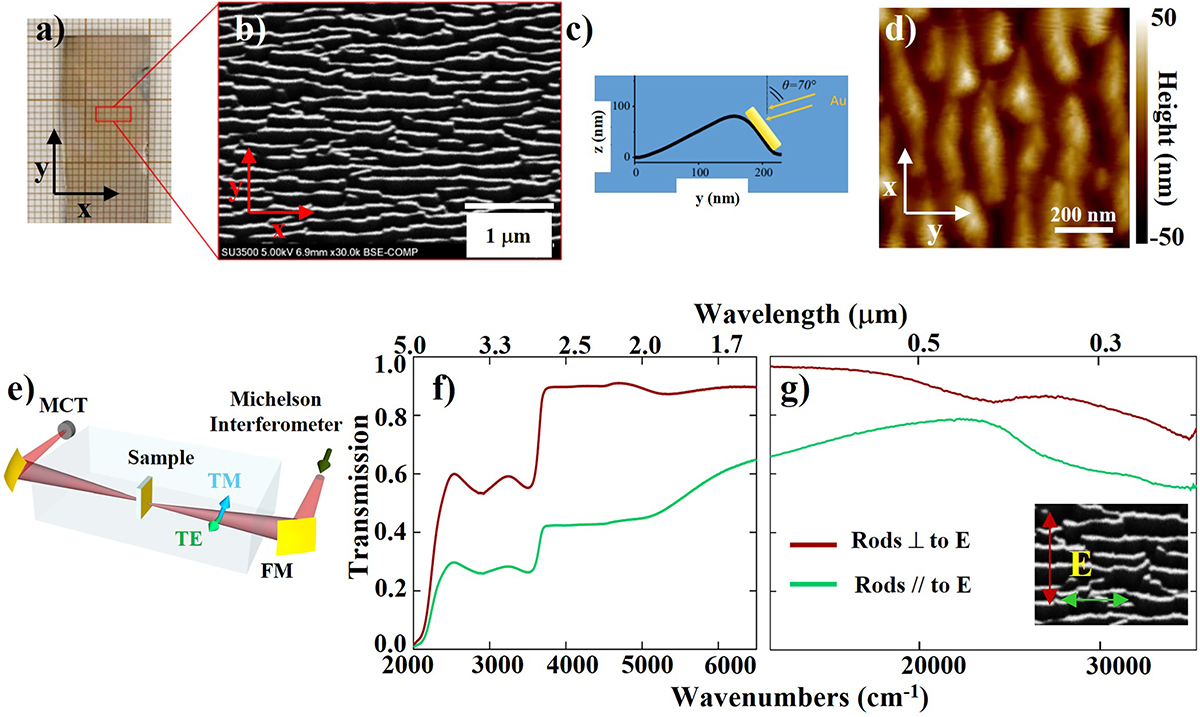
(a) Visible image of the large-area nanorod platform showing the partial transparency of the sample. The sample is placed on a sheet of graph paper in order to highlight the spatial dimensions. (b) Representative SEM image. (c) Sketch of the ripple cross section for the nanorod platform. (d) AFM topography image of the nanorod platform. Note the disordered, although strongly anisotropic, arrangement of the gold nanorod array. (e) Sketch of the optical setup used to perform IR spectroscopy in transmission mode: the incoming IR radiation is focused by a parabolic mirror (FM) onto the sample. The radiation is linearly polarized by a wire-grid polarizer (the directions of E vector for both TE- and TM-polarized light are indicated by arrows in Figure). After the interaction with the sample, the IR radiation is focused onto an HgCdTe (MCT) photovoltaic detector. (f, g) Dichroic transmittance in the IR (f) and VIS (g) range for the two possible polarizations, i.e., with E parallel or perpendicular to the main axis of nanorods.
Current usage metrics show cumulative count of Article Views (full-text article views including HTML views, PDF and ePub downloads, according to the available data) and Abstracts Views on Vision4Press platform.
Data correspond to usage on the plateform after 2015. The current usage metrics is available 48-96 hours after online publication and is updated daily on week days.
Initial download of the metrics may take a while.