| Issue |
J. Eur. Opt. Society-Rapid Publ.
Volume 22, Number 1, 2026
EOSAM 2025
|
|
|---|---|---|
| Article Number | 34 | |
| Number of page(s) | 5 | |
| DOI | https://doi.org/10.1051/jeos/2026039 | |
| Published online | 07 May 2026 | |
Short Communication
Monkeypox virus (MPXV) neutralizing antibodies diagnosis with spectral-phase surface plasmon resonance 3D imaging biosensor
Department of Electrical Engineering, Chang Gung University, Taiwan R.O.C
* Corresponding author: This email address is being protected from spambots. You need JavaScript enabled to view it.
; This email address is being protected from spambots. You need JavaScript enabled to view it.
Received:
9
December
2025
Accepted:
12
April
2026
Abstract
In this paper, we present the detection of Monkeypox virus (MPXV) neutralizing antibodies with a spectral-phase surface plasmon resonance (SPR) 3D imaging biosensor. To the best of our knowledge, this is the first demonstration of SPR imaging for MPXV neutralizing antibodies detection in the literature. The imaging biosensor provides three-dimensional molecular binding information in the x-, y- and time dimensions, enables real-time multiplex molecular bindings detection. In the optical design, a plasmonic sensing surface is placed in between a pair of polarizers with perpendicular orientation to block light transmission. At plasmonic resonance, an additional phase value is introduced for p-polarized light, while s-polarized light remains unchanged. This rotates the polarization ellipse and enables light transmission at specific plasmonic resonance wavelengths, generating the spectral-phase SPR image. In refractive index (RI) measurements, the sensor RI sensitivity was calculated to be 1191.2 Hue units/RIU. The biosensor was further applied to detect MPXV neutralizing antibodies with a 4 × 4 gold biosensor array immobilized with specific MPXV proteins and bovine serum albumin as control. The limit of detection was found to be 0.27 ng/μL with detection time of less than 16 min. This value is significantly lower than the neutralizing antibodies level (3.0 ng/μL) stimulated by MPXV vaccine reported in previous study.
Key words: Monkeypox virus / MPXV / Neutralizing antibodies / SPR imaging / Biosensor / Spectral-phase
© The Author(s), published by EDP Sciences, 2026
 This is an Open Access article distributed under the terms of the Creative Commons Attribution License (https://creativecommons.org/licenses/by/4.0), which permits unrestricted use, distribution, and reproduction in any medium, provided the original work is properly cited.
1 Introduction
According to World Health Organization (WHO), an outbreak of Monkeypox happened in May 2022 and rapidly spread across Africa countries, Europe, the Americas and Southeast Asia. Monkeypox cases have been reported in over 120 countries worldwide. Between January 2022 to August 2024, cumulative infection cases reached 1 million and 220 deaths was reported. The Monkeypox virus (MPXV) belongs to the orthopoxvirus genus within the poxviridae family of vaccinia virus, variola virus and cowpox virus [1]. The diagnosis of MPXV neutralizing antibodies in patients contributes not only to vaccination development and efficacy evaluation, but also to governmental public health planning during outbreak. Current detection methods include Plaque-Reduction Neutralization Test (PRNT), Focus Reduction Neutralization Test (FRNT) and Enzyme-Linked Immunosorbent Assay (ELISA) [2]. However, PRNT and FRNT suffer from long detection time of 3–5 days and 1–2 days, respectively, while ELISA involves complex labeling and sandwich detection process [2]. Furthermore, trained staffs and centralized laboratory facilities are required, which are often lacking in Monkeypox outbreak areas, such as The Democratic Republic of the Congo and other Africa countries.
In this paper, we propose a spectral-phase surface plasmon resonance (SPR) 3D imaging biosensor for rapid MPXV neutralizing antibodies diagnosis. The biosensor provides rapid detection results in 16 min without requiring any labeling process. Furthermore, it is a potential point-of-care diagnostic tool, which contributes to patient care in developing countries experiencing Monkeypox outbreaks. In the optical design, the plasmonic sensor head is placed between two crossed polarizers for light blocking. At plasmonic resonance wavelength, a differential phase response is introduced between p- and s-polarized light [3], which rotates the polarization ellipse and allows light at resonance wavelengths [4] to pass through, resulting in a spectral-phase plasmonic color image. In addition, the excitation beam is expanded to cover a two-dimensional (2D) gold sensor spots array (4 × 4 elements). As video data are captured over the sensor surface, the biosensor can provide three-dimensional (3D) molecular binding information in the x-, y- and time dimensions, which enables real-time acquisition of multiplex molecular binding curves for MPXV protein-neutralizing antibody interactions. Compared to the spectra-phase SPR imaging works we previously reported in [5, 6], this paper contributes to the first demonstration of MPXV neutralizing antibody detection using SPR imaging in the literature [7], while bovine serum albumin (BSA) and COVID-19 antibody detection were reported in [5, 6] respectively.
2 Material and methods
The experimental optical setup was constructed as described in Figure 1a. A fiber coupled halogen lamp was used as the broadband light source, which covers the spectral range of 350–1800 nm (Thorlab, model:OSL2). Subsequently, a telescope optical system consisting of a 10× objective lens (Olympus, model:10× Olympus plan achromat objective) and a double convex achromatic lens (Edmund Optics, model:50 mm dia. × 75 mm) expanded the beam to approximately 30 mm in diameter. A 4 × 4 gold sensor array was sputtered onto an SF-18 equilateral glass prism for plasmonic biosensing. It is integrated with a polydimethylsiloxane (PDMS) based microfluidic flow cell for sample injection. The plasmonic sensing element was placed between polarizer A and B with near perpendicular polarization angles to block light transmission. However, at plasmonic resonance, additional light phase difference was introduced between the p- and s-polarized light, that rotated the polarization ellipse and allowed light to pass through. As plasmonic excitation is a wavelength dependent process, a plasmonic spectral profile was encoded into the spectral-phase SPR image. Finally, a high-speed CMOS camera (Basler, model: acA1440-220uc) was used to capture sequence of plasmonic images up to 113 fps (corresponding to a temporal resolution of 0.0088 s), which were further analyzed using a custom-built MATLAB program. Spectral-phase SPR imaging enabled 2D detection. At video format, the sequence of SPR images can provide 3D multiplexed molecular bindings curves in the time domain. Figure 1b shows structure of the flow cell, where a flow chamber was patterned at the center of a PDMS layer. The size of the chamber was approximately 1.5 × 1.5 cm2 and with the fluidic volume of ~300 μL. During detection, a 5 mL syringe was connected to the flow cell through tubing for static sample injection.
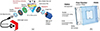 |
Fig. 1 (a) Optical scheme of the spectral-phase SPR 3D imaging biosensor. (b) Diagram of flow-cell. |
MPXV L1R neutralizing antibodies (40889-T62, 1 μg/μL), L1R protein (40889-V07E, 0.25 μg/μL) and control BSA (810651) protein samples were purchased from Sino Biological and Sigma-Aldrich, respectively. In the biosensing experiment, MPXV proteins (0.25 μg/μL) and control BSA proteins (2.94 μg/μL) were immobilized onto the 4 × 4 gold sensor array using the following surface chemistry procedures. Initially, all gold sensor spots were incubated in an 11-mercatoundecanoic acid solution (10.8 mM) for 28 h to produce a self-assembled monolayer. Subsequently, mixture of 1-ethyl-3-(3-dimethylaminopropyl) carbodiimide hydrochloride (0.4 M) and N-hydroxysuccinimide (1 M) solution were applied to activate the sensor surfaces. It was followed by a protein immobilization process of 3 h. Finally, the sensor surface was rinsed with phosphate-buffered saline (PBS) buffer before performing MPXV neutralizing antibodies detection.
3 Results and discussion
Performance of the spectral-phase 3D SPR imaging sensor was first characterized with NaCl solutions ranged from 0% to 15%, which corresponding to refractive index values between 1.3330 to 1.3585 RIU [8]. Figures 2a and 2b are the experimental spectral-phase SPR images of water (0%, 1.3330 RIU) and 15% NaCl solution (1.3585 RIU), respectively. A distinct green shift is observed with increasing refractive index values. In addition, a fiber-based spectrometer (Ocean Insight, model: Ocean HR high-resolution spectrometer) was used to analyze the visible range spectral profiles. Figure 2c presents the plasmonic excitation spectra of 0% (water), 2%, 4%, 6%, 8%, 10% and 15% NaCl solutions. The spectra exhibit a significant intensity increase within the green (500–570 nm) and yellow (570–590 nm) spectral ranges, while the red spectral region (620–750 nm) is suppressed. The spectral-phase SPR images were then quantified by extracting Hue component of the HSV color space, where the Hue value represents the dominate wavelength of color [9]. Figure 2d illustrates the Hue values as a function of refractive index. It demonstrates a linear relationship within 1.3330–1.3501 RIU. Furthermore, slope of the sensor response curve yields a sensor sensitivity of 1191.2 Hue units/RIU.
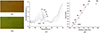 |
Fig. 2 Spectral-phase SPR images: (a) water, (b) 15% NaCl solution. (c) Reflection spectra for different concentrations of NaCl solutions ranged from 0% (water) to 15%. (d) Sensor response curve for different reflective index samples. |
The spectral-phase imaging biosensor was further applied for the detection of MPXV neutralizing antibodies. Figure 3 shows the distribution map of MKXV protein (red sensor spots) and the control BSA protein (yellow sensor spots) in the biosensor array. The functionalized sensor surface was initially kept at PBS, followed by the injection of MPXV neutralizing antibodies (13 ng/μL) to facilitate MPXV protein–antibody bindings. Figure 3 presents the molecular binding curves recorded for all 16 sensor spots. On average, the injection of 13 ng/μL MPXV antibody produced a sensor response of 1.6 Hue units. In Figure 3, the discernible signals observed at sensor spots A2, B1, C1 and D2 are attributed to non-specific bindings, potentially resulting from physical adsorption of MPXV proteins. The non-specific sensor spots can serve as control sensor sites. The final sensor response for MPXV antibody was subtracted with the average non-specific sensor responses (0.33 Hue units). In addition, the sensor measurement stability was determined to be 0.033 Hue units based on 500 measurements in PBS buffer. According to the literature [10], the biomolecular detection sensitive can be estimated to be 0.27 ng/μL using equation (1). This value is significantly lower than the previously reported neutralizing antibodies level (3.0 ng/μL) induced by MPXV vaccine [11]. (1)
(1)
 |
Fig. 3 Distribution map of the specific Monkeypox virus protein and control bovine serum albumin protein molecules on the biosensor array spots. A1–D4 shows 16 molecular binding curves recorded for all sensor spots in parallel. |
Furthermore, the observed binding kinetics difference between A1 and C3 sensor spots may cause by spatial non-uniformity of MPXV antibody molecules within the flow cell (1.5 × 1.5 cm2). Such variations could be minimized by using a syringe pump to maintain a continuous flow during detection. In addition, different concentrations of MPXV neutralizing antibodies ranged from 0 ng/μL (PBS buffer), 1.56 ng/μL, 3.125 ng/μL, 6.25 ng/μL to 12.5 ng/μL were sequentially injected onto the MPXV protein functionalized surface. Each antibodies sample was incubated for 45 min within the detection chamber to facilitate MPXV protein–antibody binding interactions. After subtracting the PBS baseline, the normalized sensor responses were plotted in Fig. A1 (Appendix). The results demonstrate a linear relationship between the sensor signals and MPXV neutralizing antibodies concentrations. Slope of the sensor response curve also provides the detection sensitivity of the biosensor. It is determined to be 8.45 ng/μL /Hue units.
Funding
This research was funded by National Science and Technology Council (NSTC), Taiwan ROC grant number NSTC 112–2221-E-182-054- and NSTC 113–2221-E-182-010-.
Conflicts of interest
The authors have nothing to disclose.
Data availability statement
Data underlying the results presented in this paper can be obtained from the author upon reasonable request.
Acknowledgments
Chi Lok Wong would like to give his sincere thanks to Yeshua for his guidance and supports in all experiments and ideas.
References
- Wang Y, Yang K, Zhou H, Immunogenic proteins and potential delivery platforms for mpox virus vaccine development: a rapid review, Int. J. Biol. Macromol. 245, 125515 (2023). https://doi.org/10.1016/j.ijbiomac.2023.125515. [Google Scholar]
- Grossegesse M, Stern D, Hofmann N, Surtees R, Kohl C, Michel J, Nitsche A, Serological methods for the detection of antibodies against Monkeypox virus applicable for laboratories with different biosafety levels, J. Med. Virol. 95(12), e29261 (2023). https://doi.org/10.1002/jmv.29261. [Google Scholar]
- Wong CL, Ho HP, Kong YK, Chen QL, Yuan W, Wu SY, Real-time protein biosensor arrays based on surface plasmon resonance differential phase imaging, Biosens. Bioelectron. 24, 606 (2008). https://doi.org/10.1016/j.bios.2008.06.013. [Google Scholar]
- Wong CL, Ho HP, Chan KS, Wu SY, Application of surface plasmon resonance sensing to studying elastohydrodynamic lubricant films, Appl. Optics 44(23), 4830 (2005). https://doi.org/10.1364/AO.44.004830. [Google Scholar]
- Wong CL, Multiplex spectral-phase surface plasmon resonance 3D imaging biosensor, Opt. Com. 584, 131815 (2025) https://doi.org/10.1016/j.optcom.2025.131815. [Google Scholar]
- Wong CL, Spectral-phase 3D surface plasmon resonance imaging biosensor for COVID-19 neutralizing antibody detection, Opt. Express 33(8), 18089 (2025). https://doi.org/10.1364/OE.550815. [Google Scholar]
- Hashemi Z, Ranjbari F, Ranc V, Fathi F, Multiplexed biosensing: a review of surface plasmon resonance platforms for biomarker analysis, Talanta 304, 129564 (2026). https://doi.org/10.1016/j.talanta.2026.129564. [Google Scholar]
- Weast RC, CRC Handbook of Chemistry and Physics, 69th edn. (CRC Press, New York, 1988). [Google Scholar]
- Jahne B, Digital Image Processing, 4th edn. (Springer, Berlin, Heidelberg, 1997). [Google Scholar]
- Wong CL, Olivo M, Surface plasmon resonance imaging sensors: a review, Plasmonic 9, 809 (2014). https://doi.org/10.1007/s11468-013-9662-3. [Google Scholar]
- Shi YT, Wang S, Hao Y, Shen X, Zhang J, Wang S, Zhang J, Fu Y, Chen R, Wang D, Shao Y, Li D, Liu Y, Isolation and characterization of e8 monoclonal antibodies from donors vaccinated with recombinant vaccinia vaccine with efficient neutralization of authentic Monkeypox virus, Vaccines 13(5), 471 (2025). https://doi.org/10.3390/vaccines13050471. [Google Scholar]
Appendix: Detection results for different concentrations of MPXV antibody samples
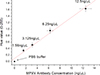 |
Fig. A1 Different concentrations of MPXV neutralizing antibodies ranged from 0 ng/μL (PBS buffer), 1.56 ng/μL, 3.125 ng/μL, 6.25 ng/μL to 12.5 ng/μL were sequentially injected onto the MPXV protein functionalized surface. Each antibodies sample was incubated for 45 min within the detection chamber to facilitate MPXV protein-antibody binding interactions. After subtracting the PBS baseline, the normalized sensor responses were plotted in Fig. A1 (Appendix). The results demonstrate a linear relationship between the sensor signals and MPXV neutralizing antibodies concentrations. Slope of the sensor response curve also provides the detection sensitivity of the biosensor. It is determined to be 8.45 ng/μL /Hue unit. |
All Figures
|
Fig. 1 (a) Optical scheme of the spectral-phase SPR 3D imaging biosensor. (b) Diagram of flow-cell. |
| In the text | |
|
Fig. 2 Spectral-phase SPR images: (a) water, (b) 15% NaCl solution. (c) Reflection spectra for different concentrations of NaCl solutions ranged from 0% (water) to 15%. (d) Sensor response curve for different reflective index samples. |
| In the text | |
|
Fig. 3 Distribution map of the specific Monkeypox virus protein and control bovine serum albumin protein molecules on the biosensor array spots. A1–D4 shows 16 molecular binding curves recorded for all sensor spots in parallel. |
| In the text | |
|
Fig. A1 Different concentrations of MPXV neutralizing antibodies ranged from 0 ng/μL (PBS buffer), 1.56 ng/μL, 3.125 ng/μL, 6.25 ng/μL to 12.5 ng/μL were sequentially injected onto the MPXV protein functionalized surface. Each antibodies sample was incubated for 45 min within the detection chamber to facilitate MPXV protein-antibody binding interactions. After subtracting the PBS baseline, the normalized sensor responses were plotted in Fig. A1 (Appendix). The results demonstrate a linear relationship between the sensor signals and MPXV neutralizing antibodies concentrations. Slope of the sensor response curve also provides the detection sensitivity of the biosensor. It is determined to be 8.45 ng/μL /Hue unit. |
| In the text | |
Current usage metrics show cumulative count of Article Views (full-text article views including HTML views, PDF and ePub downloads, according to the available data) and Abstracts Views on Vision4Press platform.
Data correspond to usage on the plateform after 2015. The current usage metrics is available 48-96 hours after online publication and is updated daily on week days.
Initial download of the metrics may take a while.