


Figure 4
Download original image
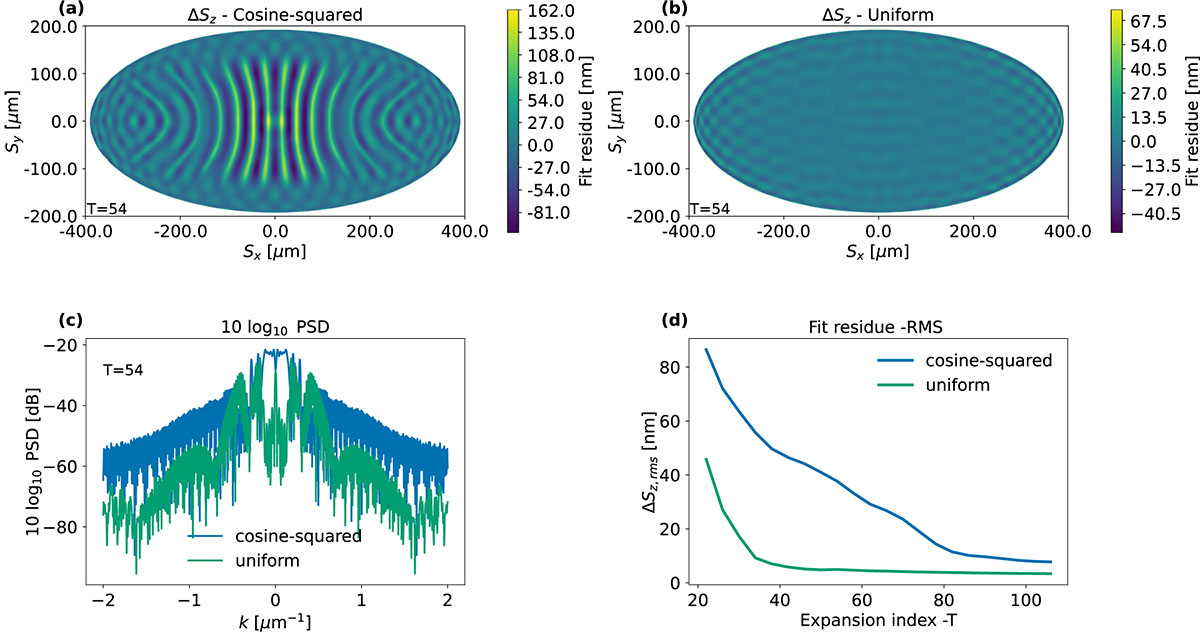
(a) and (b) present fit residue maps ΔSz obtained after using least squares projections based on Forbes Q freeform polynomials to represent both FEM solutions. (c) presents power spectral density (PSD) cross-sections extracted from both residue maps shown in (a) and (b). (d) provides a comparison between ΔSz RMS curves as a function of the expansion index T.
Current usage metrics show cumulative count of Article Views (full-text article views including HTML views, PDF and ePub downloads, according to the available data) and Abstracts Views on Vision4Press platform.
Data correspond to usage on the plateform after 2015. The current usage metrics is available 48-96 hours after online publication and is updated daily on week days.
Initial download of the metrics may take a while.