


Fig. 2
Download original image
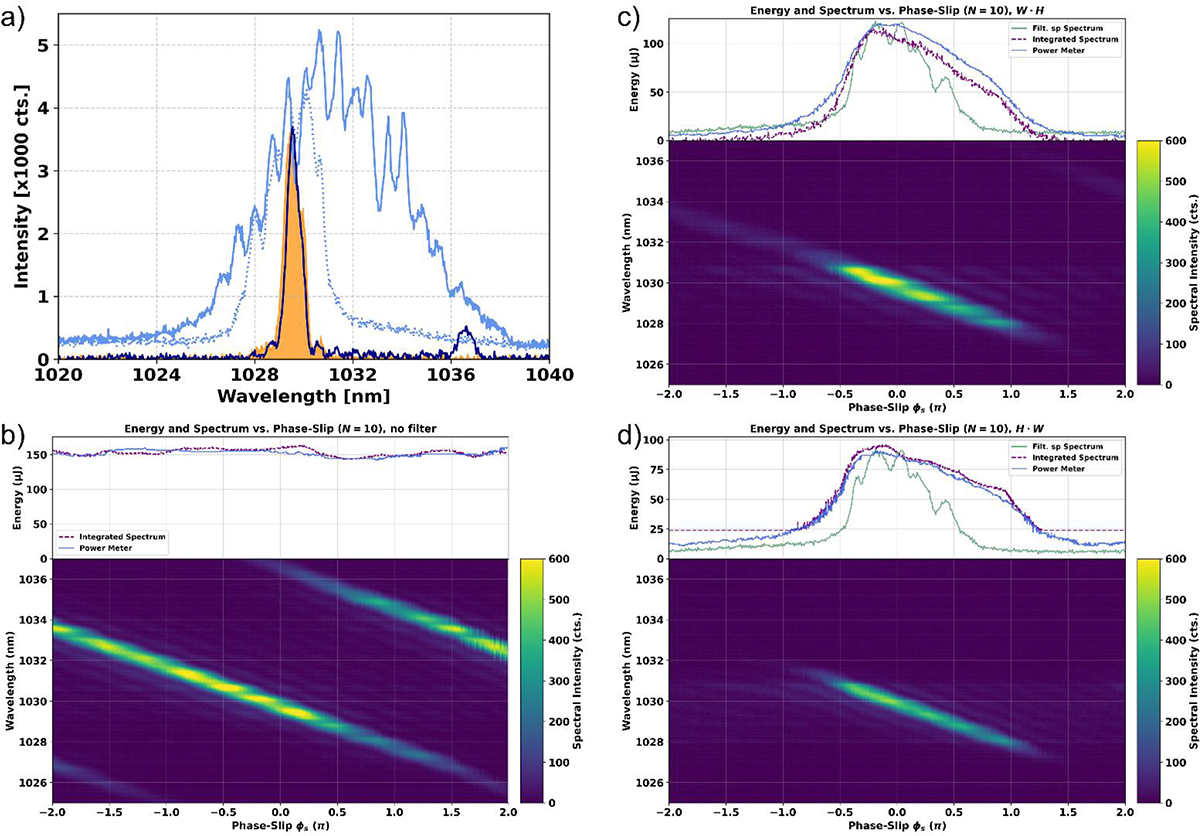
a) Single-pulse spectrum (lightblue-solid), the filtered single-pulse spectrum (lightblue-dotted), the burst spectrum (darkblue-solid), and the filtered burst spectrum (orange-filled). (b)–(d) Measured energy (top) and spectra (bottom) dependent on the phase-slip offset in burst-mode (10 pulses) at 0.52 ps intraburst pulse spacing. (b) Without spectral filtering. (c), (d) With spectral filtering (c) after and (d) prior to amplification. For validation, the spectral sum  at each corresponding phase slip Φs,m (blue line) is compared with the energies acquired from the powermeter (purple-dashed line). For the spectrally filtered cases, the filtered single-pulse spectrum is also included.
Current usage metrics show cumulative count of Article Views (full-text article views including HTML views, PDF and ePub downloads, according to the available data) and Abstracts Views on Vision4Press platform.
Data correspond to usage on the plateform after 2015. The current usage metrics is available 48-96 hours after online publication and is updated daily on week days.
Initial download of the metrics may take a while.