Figure 3
Download original image
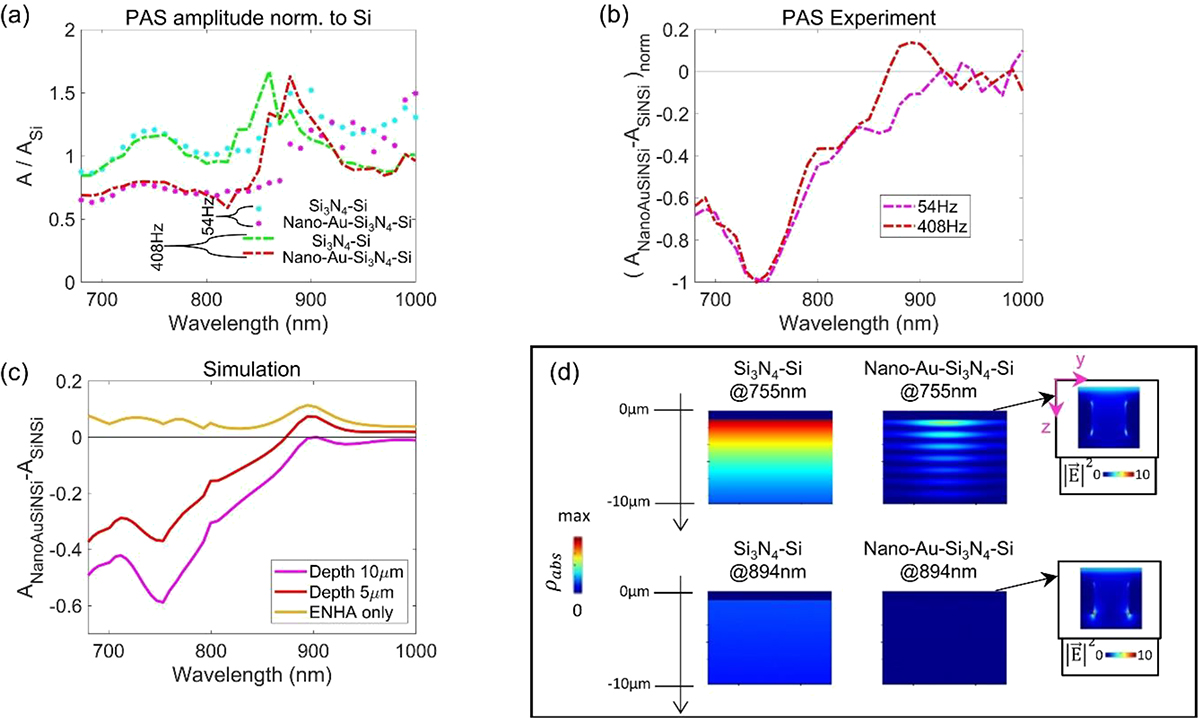
(a) Photo-acoustic spectra of Si3N4–Si and Nano-Au–Si3N4–Si at 54 Hz and 408 Hz, normalized to the bare Si spectra obtained at the same frequencies. (b) Experimental absorption difference between Nano-Au–Si3N4–Si and Si3N4–Si, normalized to maximum, at 54 Hz and 408 Hz. (c) Simulations of absorption differences between Nano-Au–Si3N4–Si and Si3N4–Si, where the partical absorption was integrated in over 10 μm or 5 μm of Si depth and including the upper plasmonic layers for the nanostructured sample. (d) Absorption confinement differences between Nano-Au–Si3N4–Si and the substrate over first 10 μm of depth, at the absorption difference dip at 755 nm and peak at 894 nm. Insets plot the electric field intensity around nanohole.
Current usage metrics show cumulative count of Article Views (full-text article views including HTML views, PDF and ePub downloads, according to the available data) and Abstracts Views on Vision4Press platform.
Data correspond to usage on the plateform after 2015. The current usage metrics is available 48-96 hours after online publication and is updated daily on week days.
Initial download of the metrics may take a while.