Figure 2
Download original image
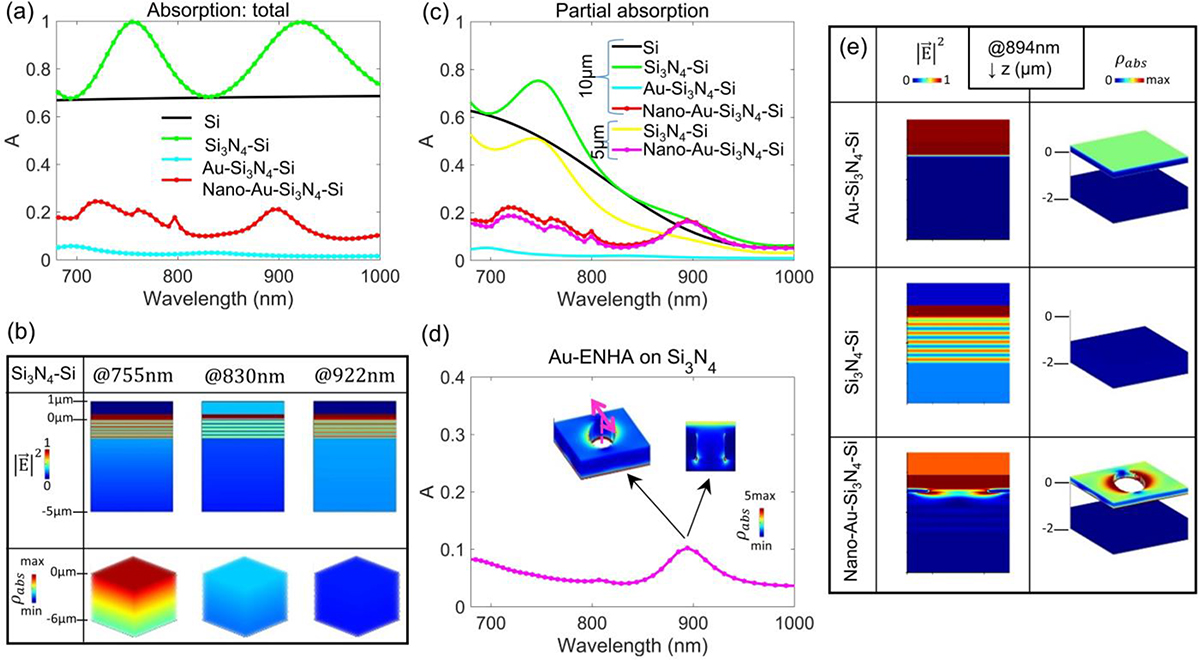
(a) Total absorption calculated as 1-reflectivity shows resonant modes in Si3N4–Si and overall lower absorption in the nanostructured sample. (b) Distribution of electric field intensity and absorption density in Si3N4–Si strongly depends on Si behavior at cavity resonant wavelengths. (c) Partial absorption is calculated by integrating absorption density over first 5 μm or 10 μm of Si in Si and Si3N4–Si, and adding the Au part for Au–Si3N4–Si and Nano-Au–Si3N4–Si. (d) Total absorption of Au ENHA on Si3N4 shows resonant absorption peak at 894 nm. (e) Electric field intensity and absorption density in the first 2 μm of depth of the three samples.
Current usage metrics show cumulative count of Article Views (full-text article views including HTML views, PDF and ePub downloads, according to the available data) and Abstracts Views on Vision4Press platform.
Data correspond to usage on the plateform after 2015. The current usage metrics is available 48-96 hours after online publication and is updated daily on week days.
Initial download of the metrics may take a while.