Open Access
Figure A1
Download original image
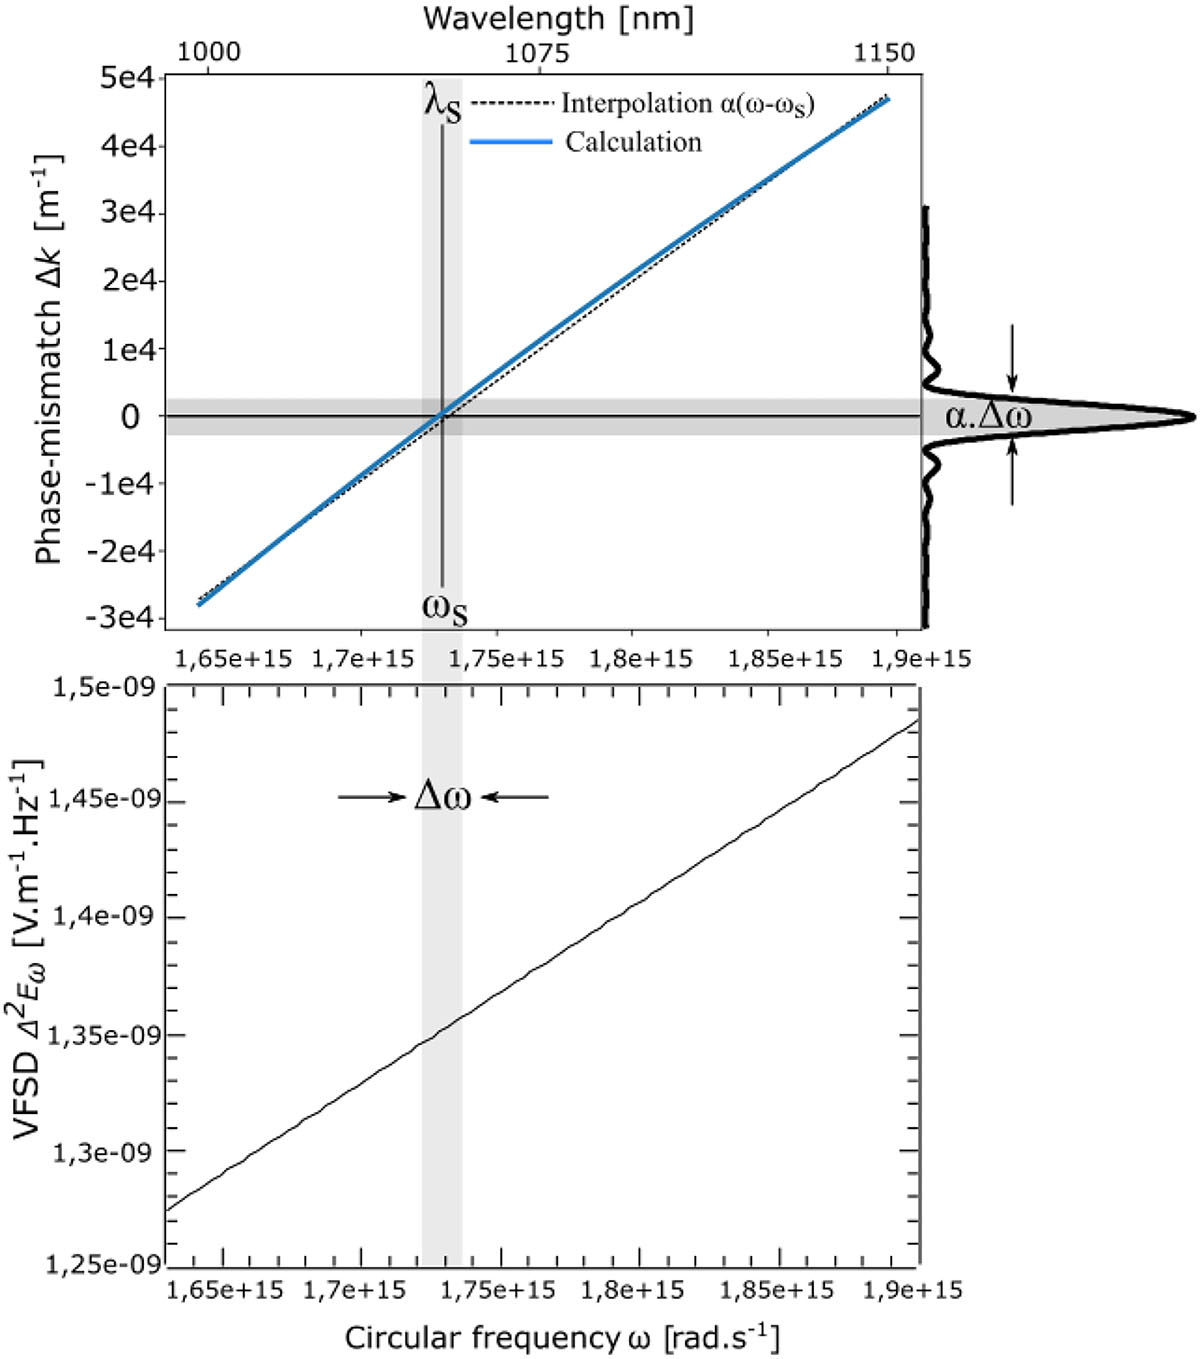
(top) Phase-mismatch angular frequency dependency of type II SPDC in a x-cut KTP. The blue curve corresponds to the calculation of Δk(ω) using Sellmeier’s equations from [1]. The dashed line corresponds to the interpolation using Δk ≈ α(ω − ωs). (bottom). The quantity Δ2Eω is the vacuum fluctuation spectral density.
Current usage metrics show cumulative count of Article Views (full-text article views including HTML views, PDF and ePub downloads, according to the available data) and Abstracts Views on Vision4Press platform.
Data correspond to usage on the plateform after 2015. The current usage metrics is available 48-96 hours after online publication and is updated daily on week days.
Initial download of the metrics may take a while.