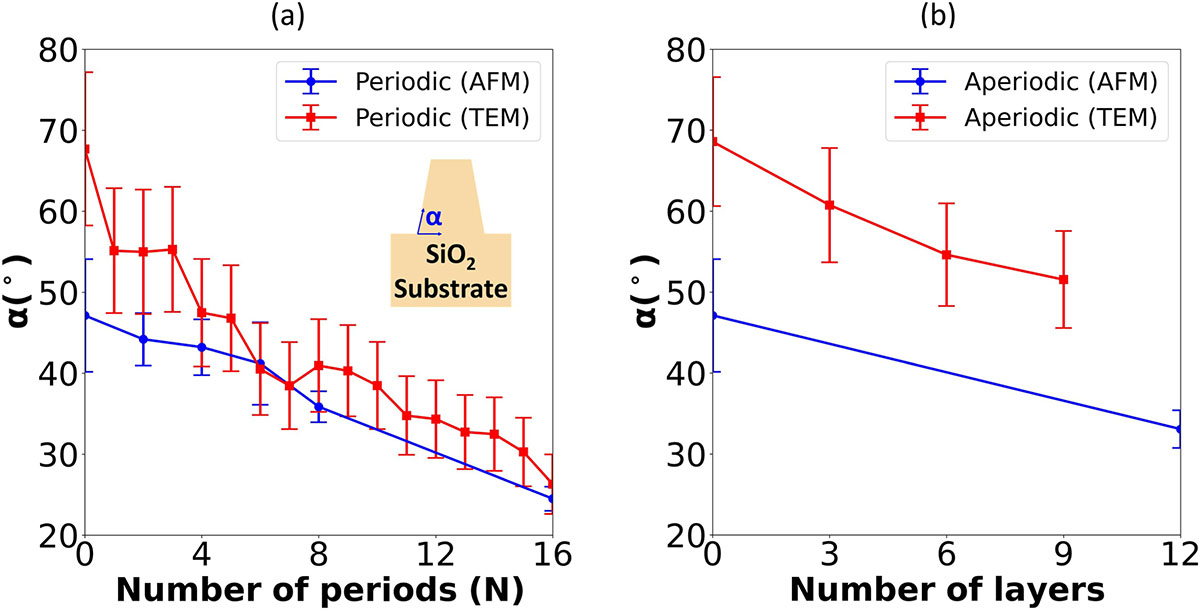
Fig. 5
Download original image
Slope of the groove profile (α) as a function of the number of deposited periods N (resp. number of deposited layers) measured by TEM and by AFM for (a) the 16-period and (b) the aperiodic ML gratings. For TEM, the error bars on the slope (α) are calculated by averaging the relative standard deviation at each N. For AFM, the error bars correspond to the standard deviations on the measurements over 6 grating periods (i.e., 12 different α values) for each N.
Current usage metrics show cumulative count of Article Views (full-text article views including HTML views, PDF and ePub downloads, according to the available data) and Abstracts Views on Vision4Press platform.
Data correspond to usage on the plateform after 2015. The current usage metrics is available 48-96 hours after online publication and is updated daily on week days.
Initial download of the metrics may take a while.